Date: May 16, 2015
image

1
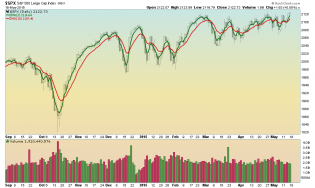
$SPX
Short term trend is bullish but we're at the top of the range, doji on the daily, a breakout or stay within the range?
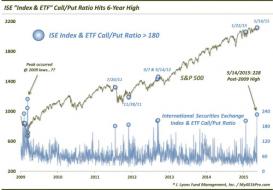
$NYSI
Weekly breadth is on a sell
1
$SPX
Weekly $SPX - persistent bull, hammers on the last two candles = more buying?
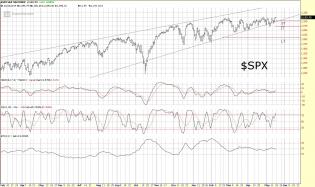
content.screencast.com/use.../SPX51515.jpg
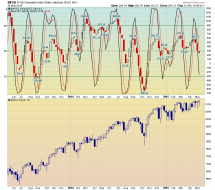
$SPX Daily Chart
Wedge still holding. On a buy on all timeframes, testing a breakout to new highs.

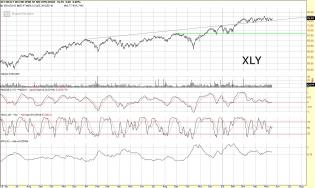
content.screencast.com/use.../XLY51515.jpg
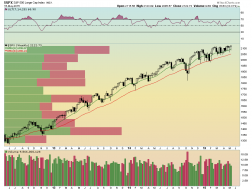
XLY Daily Chart
Breakout support still holding. Could start a new upleg higher at any time.