Date: May 27, 2015

intc.png
INTC: Bearish case if this is in fact a head shoulders top the gap at 35 could get filled to put in a right should...

2
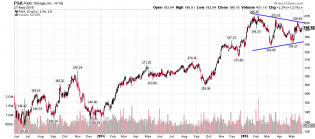
psa.png
PSA: Symmetrical Triangle. Is a buy signal at $201.00 with a 15-20 dollar move up. A short would be a break of 186.00.
1
stockchart.png
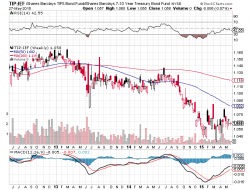
Inflation Trend, TIP:IEF
"Diamond Pattern"
'usually form over several months in very active markets. ... is cons...

1
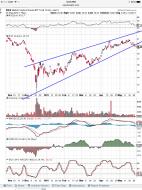
image.jpg
RSX - following up on TK's RSX short. Falling out of a rising wedge. If December is any guide, this one could fa...

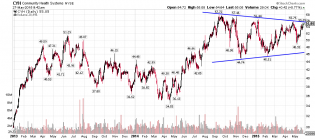
cyh.png
CYH: Symmetrical Triangle. This one may break out to the upside if price crosses 55.75 the target for the triangle...
2

20150526fxy.png
Watch your step!


yen
Yen Triangle Trade Setup

1