Date: May 2015: ES_4Hour_TwoBearFibScenarios_May132015.jpg
ES_4Hour_TwoBearFibScenarios_May132015.jpg
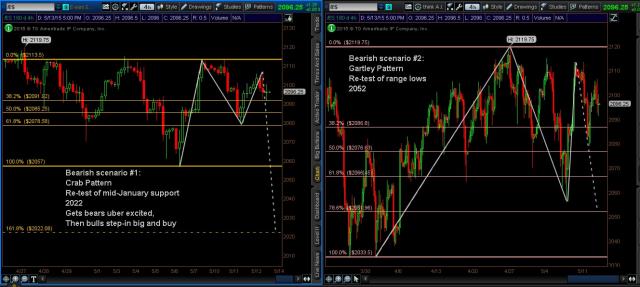
Zooming out a bit, the series of lower highs we've made on the /es since April 27th new all-time high, has set-up two bearish shorter-term swing scenarios, based off of fibonacci price patterns.
Scenario #1 - Crab pattern: The beargasm that doesn't end well.
We see a 75 point sell-off back to mid-January range lows support area. Bears get all excited about the pending correction beginning... until the bulls step in an buy heavy going into Q3.
Scenario #2: Gartley pattern (more likely imho)
We see a smaller breakdown back to the late March/early April low range at 2052. Bulls would buy it up from there.
Of the two, I think scenario #2 is more likely IF there's a move lower at all. We've been stuck in this range trade since December, and the upper half of it since February. We've seen ZERO conviction in either direction.
Breaking beneath the 2066.50 level is key, as that has been support since early April.


At this time, a 110 point sell-off seems highly unlikely. 5/13/15