Date: August 16, 2016

esH2log.png
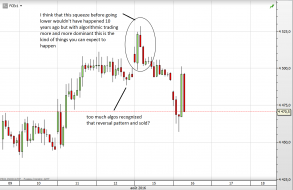
Chart of the day is $ES by www.tradingchannels.uk


20160815wta_2016.png
Buying Trump low


20160816_ip1.jpg (964×503)
US Industrial Production Slumps To Longest Non-Recessionary Contraction In History
1

7 aug16.PNG
You can see that with spread chart is essentially the same


6 aug16.PNG
interesting divergence/correlation versus price
1

5 aug16.png
4 aug16.png
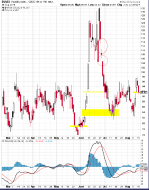
cac40 index
3 aug16.png
Volatility of volatility closed an other gap yesterday
Two gaps left (last few months) higher
2 aug16.png
VIX original formula and it's ratio to VIX of VIX still are off the charts.
If you want the same with VIX new for...

1 aug16.png
SPY daily hammer
MACD, PMO AND KST still are in a sell signal