Date: August 18, 2016
1 aug19.png
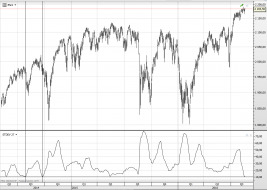
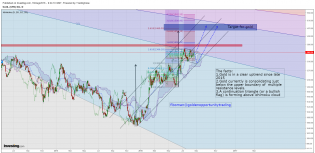
last two times we were at this level it didn't end well!
And at that time there still was QE even if it already w...

wheatH4log.png
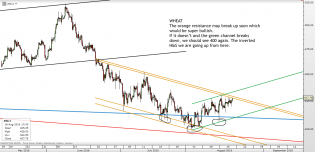
Chart of the day is #WHEAT by www.tradingchannels.uk

3
![GDP-4-Panel-Chart-QE-081816[1].png](https://s3.amazonaws.com/cdn2.socialtrade.com/st/shards/18206_t8qblDtR_h)
GDP-4-Panel-Chart-QE-081816[1].png
of course we gonna see the fed normalize rates... rofl

Why The Average American Is Angry (In 6 Simple Charts) | Zero Hedge
Median household income has NOT recovered since the financial crisis
1

Why The Average American Is Angry (In 6 Simple Charts) | Zero Hedge
The rich get richer
1

Why The Average American Is Angry (In 6 Simple Charts) | Zero Hedge
Wages converge

1 aug18.png
Big gap between NIKKEI and USD/JPY
Ratio back at big resistance
Wich one is right? both?
5

yoda-is-disciplined.png
My low-risk way to buy leading stocks in a runaway market: http://www.morpheustrading.com/blog/low-risk-stocks-bull-m...

2
![20160818_open[1].jpg](https://s3.amazonaws.com/cdn2.socialtrade.com/st/shards/18199_P6YNo8hQ_h)
20160818_open[1].jpg
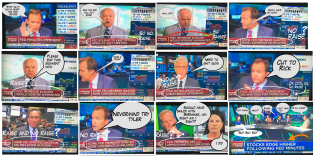
No comment...
7

IBB - Weekly - 8.18.16.png
IBB - weekly chart. This is not investment advice.

1
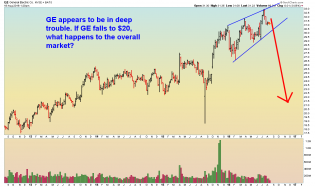
GE - Weekly - 8.18.16.png
GE - weekly chart. This is not investment advice.
1
009 tick.png

1

image.jpg
Corn basing pattern

gold 18.08.16.png
Towards 1450-1500

1

Yen August 2016.png

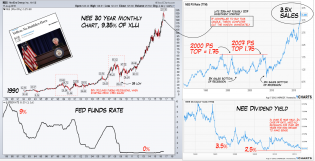
NEE P_S.png
Fed minutes 3.png