Date: August 25, 2016

2 aug26.png
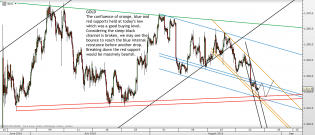
My guess is that if a big fall is ahead of us it will happen very soon from now
And structure of last move since...

goldH1log.png
Chart of the day is GOLD by www.tradingchannels.uk

3

1 aug26.png
long term macd indicating to me:
reversal
still overbought
downside momentum building
divergence
3

8 aug25.PNG
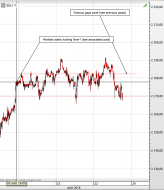
My view on sp500 right now
![20160824_JHOLE2[1].jpg](https://s3.amazonaws.com/cdn2.socialtrade.com/st/shards/18267_2RnUSWT4_h)
20160824_JHOLE2[1].jpg
Rate hike odds fell in tandem with stocks since june of 2015
Are rate hikes odds gonna collapse??? (remember all...

7 aug25.PNG
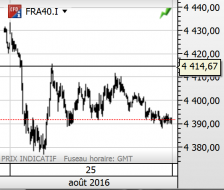
2 days in a row
Plunge protection team? Big imbalences building during the day session? or markets becoming nervous?
6 aug25.PNG
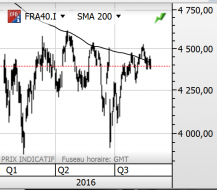
and here is 200dma on a big picture...
5 aug25.PNG
Cac40 broke 200dma at the open then retested it nicely then failed to retest a second time
SEE NEXT POST

2 aug8.PNG
RESTACK
Still a possibility
I have to admit that if I was right, I didn't expected such a long time to trap bull...
2
4 aug25.png
update
3

3 aug25.png
Just to show you I'm still short right now and didn't change my mind at all since more than one month now...
1
2 aug25.png
My double top call with rsi divergence on dow jones industeial dwo days ago seems to confirm.
Simpliest and clearest...
1
![20160825_lowvol1[1].png](https://s3.amazonaws.com/cdn2.socialtrade.com/st/shards/18258_8xwQzwus_h)
20160825_lowvol1[1].png
part of the article:
..."Meanwhile, we are now treated to stories of state pensions in Hawaii and South Carolin...
2

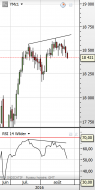
China - Daily - 8.25.16.png
China - daily chart. This is not investment advice.

6
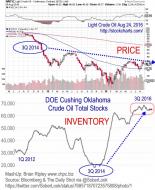
Oil Stock Inventory
Videos included: Grim expense report: Alberta's debt soars to $10.9 billion AND The Grand Opening of the Tesla Gig...

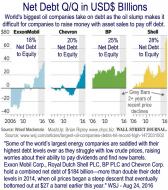
Big Oil Net Debt to Equity
"Some of the world’s largest energy companies are saddled with their highest debt levels ever as they struggle w...
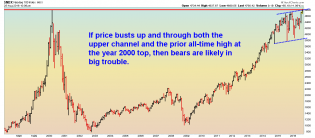
NDX - Monthly - 8.25.16.png
NDX - monthly chart. This is not investment advice.
2

1 aug25.png
I'll take 5 then 2 (maybe 3 between both)
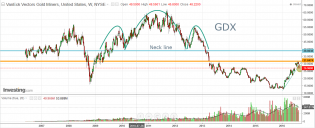
20160825_gdx.png
Support line is broken. Looks like correction has started. Good opportunity to buy is coming.

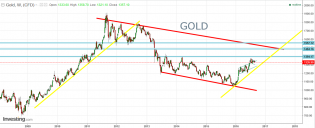
20160825_gold.png
Looks bullish. Gold is going to test red line resistance in coming months.