Date: May 10, 2016
Commodities 1980-2016 & High Yield Defaults
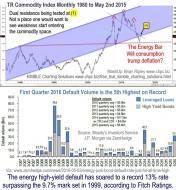
The top panel in the mashup above is the Thomson Reuters Commodity Index chart since the 1980's provided by Kimble...


Fox Trot by Bill Amend
Encouragement can be found in Warren Buffett’s admonition in the Berkshire 2006 annual report, which I (Frank Ma...
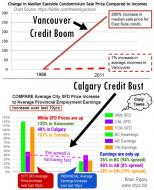
Credit Boom, Credit Bust Price vs Value
The ratios of average housing prices to average incomes are 13.2 in Vancouver and 7.7 in Toronto. These can only b...
dowH2log.png
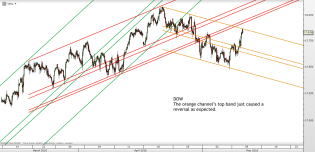
DJIA

2
silverH6log.png
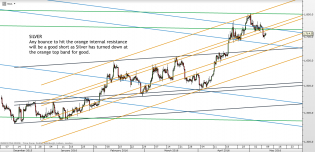
SILVER
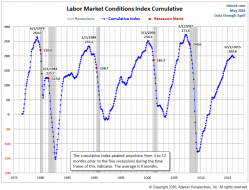
Labor Market.PNG
Dshort Labor Market Conditions w Recessions

2
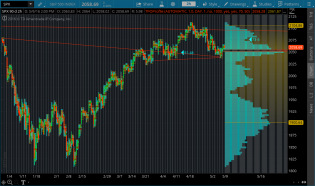
2016-05-10-TOS_CHARTS.png 73 5 spx.png

1
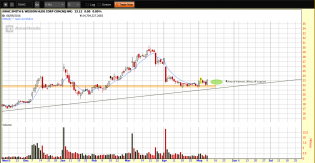
SWHC - 6 month daily chart.png
SWHC (6 month, daily chart) has a forecasted earnings growth rate of 26% and looks to be lifting off this area of...
