Date: October 19, 2016
wtiH2log.png
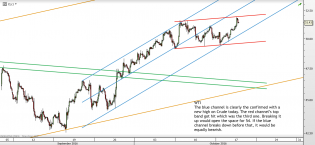
Chart of the day is #oil at www.tradingchannels.uk


The Long Finger of Doom
Stocks vs. Bonds - big move soon?

20161019_huss1.jpg (1375×1241)
Long-term federal funds rate

FTSE - Weekly - 6.27.16.png

2
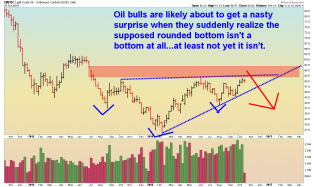
Oil - Daily - 10.19.16.png
Oil - daily chart. This is not investment advice.
7
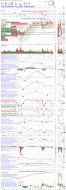
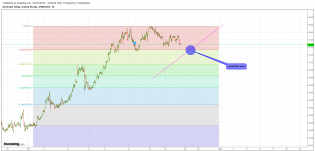
009 xiv.png
xiv analysis

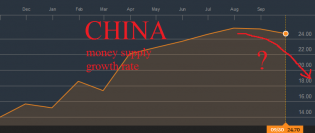
20161019_ChinaYoY.png
Chinese money supply growth rate has started to decline. It may cause economic burst around the world.

2
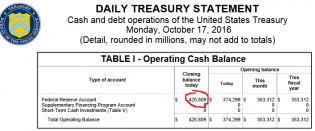
20161019_Treasury.png
General treasury account. $420 billion!!! Very, very dangeries level. Are they accomulating cash for risk management...
2
dxy 19.10.16.png
dxy 15min

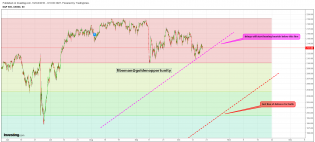
spx 19.10.16.png
spx