Date: October 3, 2016
wtiH8log.png
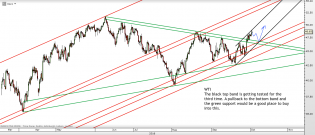
Chart of the day is $OIL by www.tradingchannels.uk.


wmc161003b.png (860×717)
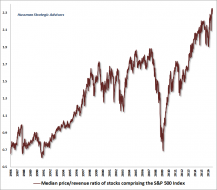
Ratio of enterprise value to corporate gross value-added is now nearly equal to the level observed at the 2000 mar...
wmc161003c.png (791×690)
Presently, the median stock in the S&P 500 is more overvalued than at any point in U.S. history, easily exceeding...
1

9 oct3.PNG
Hahahahaha! Who the fuck is gonna believe that?
But I'm very glad to see that because if we were near zero I thin...

![SP500-Forward-Estimates-2-100116[1].png](https://s3.amazonaws.com/cdn2.socialtrade.com/st/shards/18726_5czga9fq_h)
SP500-Forward-Estimates-2-100116[1].png
Still works...
![SP500-Forward-Estimates-100116[1].png](https://s3.amazonaws.com/cdn2.socialtrade.com/st/shards/18725_bqXIa6EH_h)
SP500-Forward-Estimates-100116[1].png
Fool me once shame onyou
Fool me twice shame on me
Fool me everytime you need to...shame on...
3
8 oct3.PNG
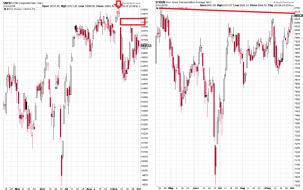
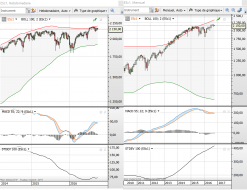
NYSE composite still in a perfect (gap still open and acting as resistance) top island reversal!
Dow transports i...

7 oct3.PNG
SPY
Zero gaps to fill above, a lot below!
7

6 oct3.PNG
Earnings results (above 10billions in market cap)
As of oct18 publications will be in full momentum until oct25

5 oct3.PNG
8H chart trendlines
Ct3dKCVWIAAGHGe.jpg:large (700×549)
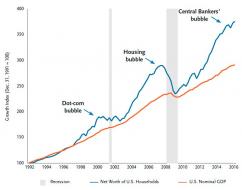
Bubbles bubbles
3
4 oct3.PNG
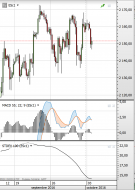
4H chart
Long term MACD sell signal almost complete
STDEV big breath
Crucial time approaching

3 oct3.PNG
In gold I still trust
2 oct3.PNG
The combination of these 2 is IMO a big warning/problem
![20161003_RPI2[1].jpg](https://s3.amazonaws.com/cdn2.socialtrade.com/st/shards/18717_LiZ7bXc3_h)
20161003_RPI2[1].jpg
Recession?
5
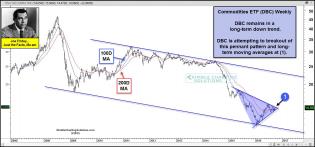
joe-friday-dbc-breakout-test-in-play-sept-30.jpg (1571×735)
Commodities in a pennant formation

ES_triangle_10-3-16.PNG


1 oct3.PNG
Momentum still weak
Let's see how markets react with new SIP.
Last time was just a test during a small part of t...