Date: September 8, 2016
goldH4log.png
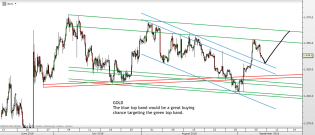
Chart of the day is $GOLD by www.tradingchannels.uk

jnk-testing-breakout-level-sept-7.jpg (1570×733)
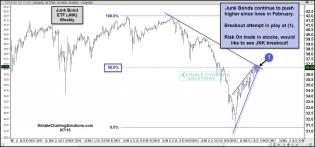
Junk bonds
1
009 gold.png

2
160908 - Low Relative Volatility.jpg

1
9 sept8.PNG
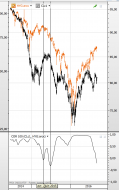
HYG (not total return performance) and crude oil and their 100 day correlation
Who's right this time?

1

8 sept8.PNG
Nasdaq ETF since brexit
I bet it's a topping structure
7 sept8.PNG
Leading indicator?
6 sept8.PNG
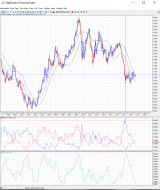
EUR/USD monthly
Long and flat breath since the bottom
Completely unextended now after beeing extremely stretched

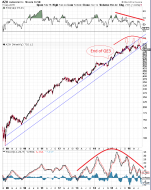
5 sept8.PNG
Already A LOT tighter than Q3 2014 (end of QE3 tapering)
And balance sheet hasn't and will NEVER normalize but...

4 sept8.PNG

3 sept8.PNG
Makes a lot of sense

2 sept8.PNG
No comment...