Date: February 4, 2017
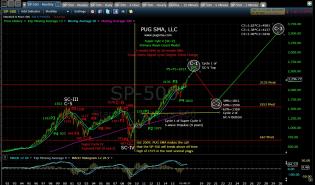
pug-sp-500-monthly-1-26-17.jpg (1476×870)
PUG's long-term view
1
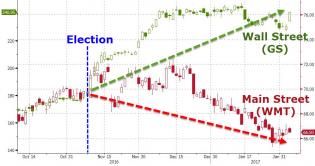
20170204_wall.jpg (964×510)
A bit of a divergence
8 feb4.PNG
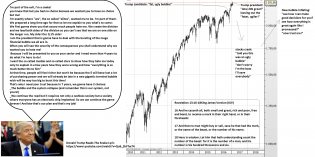
Donald Trump Reads The Snake Lyric
https://www.youtube.com/watch?v=Qu6_2hFTw74

3
7 feb4.PNG
You can see that the global economy is much much weaker than during the last tightening cycle.
No surprise there,...

6 feb4.PNG
This tightening cycle was different than in the past because the last easing cycle was different than in the past!

5 feb4.PNG
Seriously!
Are you guys believing that shit show?
Deception, delusion, I think that can be interpreted by what...

Nominal Gains
The S&P 500, Dow and Nasdaq Since Their 2000 Highs

Standard Deviations
Market Remains Overvalued

Unemployment and the Market
The unemployment peak for the current cycle was 10.0% in October 2009. The chart here shows the pattern of unemployme...

PAYEMS Monthly Change
January Jobs Report: Surprising 227K New Jobs, Better Than Expected
1

WLI since 2000
ECRI Weekly Leading Index: "Future Inflation Gauge Leads Inflation Expectations"

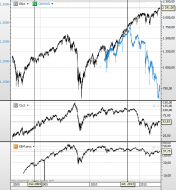
4 feb4.PNG
What a surprise!
Fools taking profit or anticipation of a new deflationary crash?
4
3 feb4.PNG
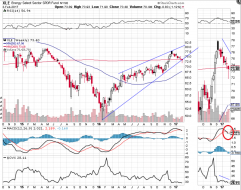
XLE warning for what's coming?
...Or are oil traders right? (OVX is oil volatility)
1

2 feb4.PNG
CNN fear & greed (rigged) index!
2

1 feb4.PNG
It may only be for political reasons but I doubt it is!