Date: July 25, 2017

vrtx.png
VRTX unusual options volume

1

image.png
Bond bearish bias. Slope after dark

20170725_EOD2.jpg (1577×844)
VIX has not closed above 10 for 9 straight days - starting with Yellen's dovish Humphrey Hawkins testimony - this...
2
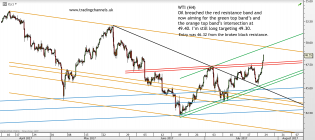
wtiH4log.png
Chart of the day is #OIL at http://www.tradingchannels.uk

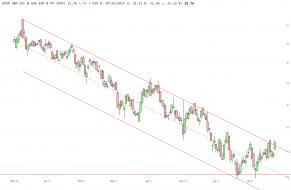
slopechart_XOP (3).jpg
XOP in familiar territory.

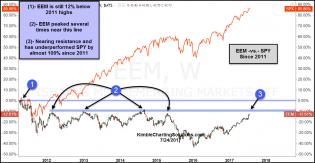
eem-vs-spy-since-2011-highs-july-24.jpg (1297×673)
Below compares the performance of EEM to the S&P 500 since 2011
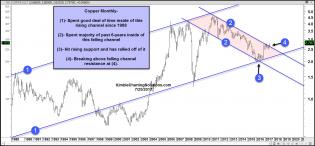
copper-monthly-breaking-out-july-25.jpg (1573×732)
Below looks at Copper Futures on a monthly basis, since the late 1980’s. A good deal of the past 30-years, Doc C...

IMG_9870.PNG
2

IMG_9871.PNG
Vix
2