Date: June 17, 2017
CrudeShortSignalContinuing.png
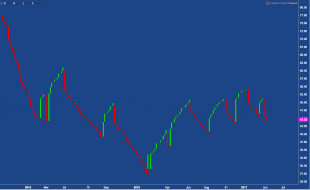
I use these LineBreak charts often with my ForkTrading. here we see $CL in a confirmed short status.

1
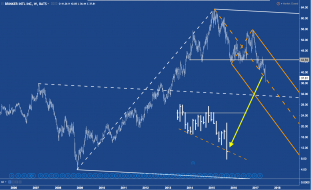
DeathOfCrudeBeginOfSolarAndHoneyBees.png
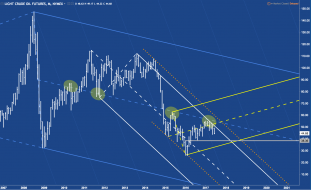
There's a long way down to go for the monthly.
On the daily, I wait for a pullback to load up.
In the meanti...
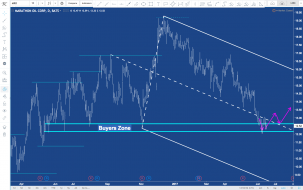
Gold@decision point.png
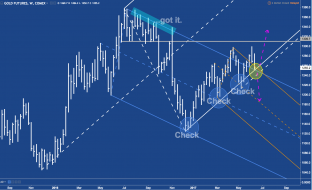
I see that Gold has risen above the U-MH's.
But also stalled there, now trading back into the orange fork, and cl...
2

bradley-model-turn-date-chart.png (927×664)
Bradley Sideograph for 2017
3
MSFT get's halberded.png
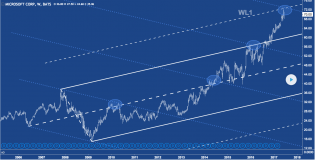
As you can see, not only the A/R-mesures catching the frequency of the price.
The WL1 indicates, that a good co...
3
EAT.png
Courious if it holds...
On a break of the centerline, I grab my big hammer.
3
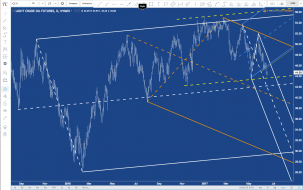
CL.png
Crude - Waiting for a pullback to short.
1
Bildschirmfoto 2017-06-17 um 16.52.50.png
MRO
2