Date: June 27, 2017
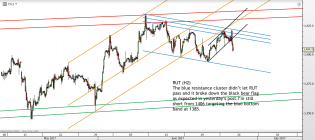
rutH2log.png
Chart of the day is $RUT at www.tradingchannels.uk


20170627_odd4.jpg (962×480)
Commodities (AKA reality) versus Stocks (AKA pot-induced fantasy)
1

20170627_odd5.jpg (962×507)
S&P value versus Motherfucking Central Bankers
2

20170627_odd3.jpg (963×486)
Treasury versus Stocks

20170627_odd2.jpg (855×505)
NASDAQ versus earnings

20170627_odd1.jpg (963×512)
The S&P versus Reality

20170627indu_usb.png
Long-term look at INDU vs USD (30-Yr Treas). The Trump overshoot?


IBB.jpg
$IBB target short


endofQoutofbonds.jpg
End of Q out of bonds, systematic walk down-----KGS

stock-bond-ratio-breaking-below-dual-support-june-26.jpg (1295×680)
Over the past 90-days, bond ETF ZROZ has nearly doubled the returns of the S&P 500. Despite the S&P doing well thi...
5

performance-zroz-vs-spy-past-90-days-june-26.jpg (1300×677)
Stocks have done well this year and the past 90-days. Which would you rather have owned the past 90-days and Year...
1
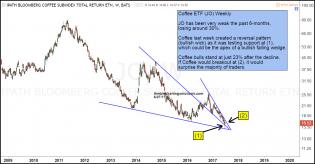
jo-testing-support-at-the-apex-of-bullish-falling-wedge-june-27....
Coffee has been anything but hot of late! Actually it has been pretty cold performance wise, as it has declined ov...
1
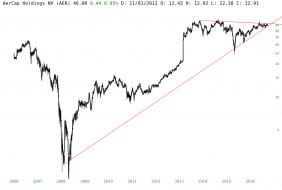
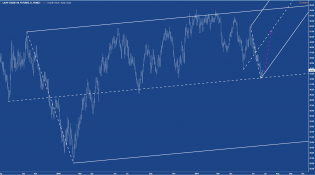
slopechart_AER.jpg
AER 2017.06.27
Decision time

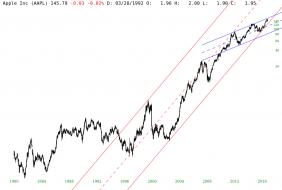
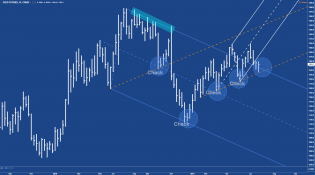
slopechart_AAPL.jpg
AAPL 2017.06.27
Long- and short-term channel crossing
GC_Controlversal.png
Hmmm.... On the daily I'm bearish. The weekly tells another story, although price would first test the L-MLH of th...

CL_DeadEnd_TurnAhead.png
CL landed on the centerline, without breaking through. A nice indication that we will at least see a bigger bounce.
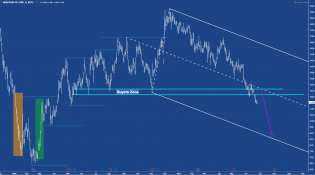
MRO.png
Prior idea did not work out.
So I wait for a pullback to the centerline and take it short from there.