Date: May 8, 2017
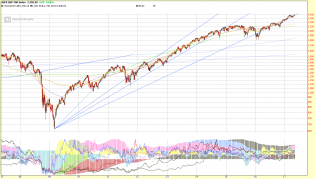
$SPX May 08 17 10 Year Weekly.png


20170508_japan.jpg (957×501)
Japanese Wages Fall At Fastest Pace In 2 Years;
1
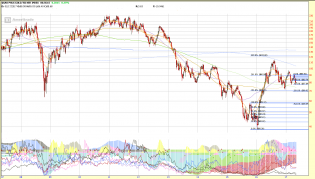
$XAU May 08 17.png
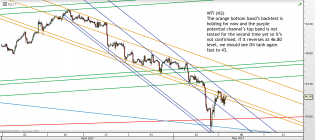
wtiH2log.png
Chart of the day is #OIL at www.tradingchannels.uk


20170508_spx.jpg (965×508)
Based on the Panic-Euphoria model, the S&P 500 has not been this "euphoric" since Jan 1994 (and historically has n...
1

20170508_soft.jpg (1161×725)
'Soft' Data Collapses Back To 'Hard' Data Reality

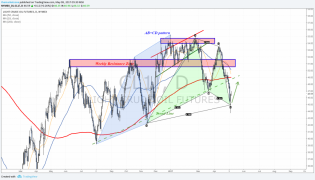
london-creating-series-of-lower-highs-may-2.jpg (1567×734)
London; Breaking support of bearish rising wedge?
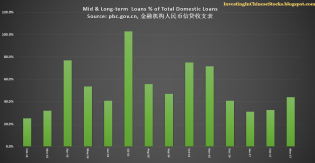
201703mortgage.png
Mortgage lending in Beijing contracted 20% in April thanks to a bundle of buying and selling restrictions implemented...

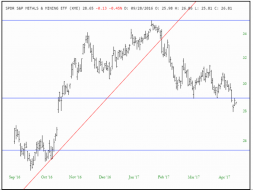
XME short_8MAY17.PNG
Absolutely love the new charts. Plagiarizing the great TK as best I can. Lower blue line target with a stop above...

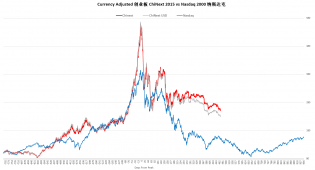
20170508chinext.png
ChiNext broke to a new post-bubble closing low today.
click to enlarge
Gartley pattern stopped Oil's decline. Will it push it to 50$?
