Date: October 11, 2017
goldH2log.png
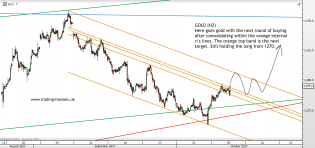
Chart of the day is $GOLD at http://www.tradingchannels.uk


3NlQbIzTHwphIptkuQyffjllewdLsJZc1ss_G72USek.png (809×768)
The changing American household
1

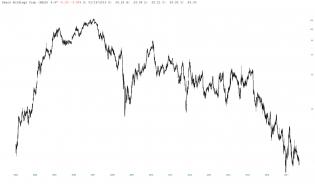
nikkie-testing-24-year-breakout-level-again-oct-11-1.jpg (1295×675)
The Nikkei index has found a certain price level very tough to break free from for the past 24-years. Below looks...
slopechart_SHLD.jpg

1

A86CA8FF-72EA-4DAB-AFFD-6D0BD0B4798A.png
Wait for retrace to 76.7 then buy longer term put

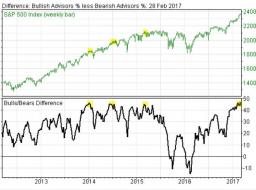
SPXweekly.jpg
Other times since 2009 that newsletter bulls-bears spread was >45%. Last time was March ($SPX fell 3% during month)

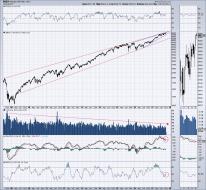
NAS100.jpg
Nasdaq 100 weekly divergence stacking up.
MACD, money flow, volume.
Rising wedge formation