Date: October 3, 2017
wtiH2log.png
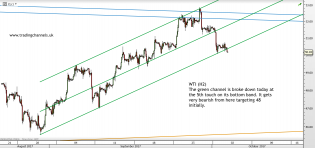
Chart of the day is #OIL at www.tradingchannels.uk


20171003_housing.jpg (909×508)
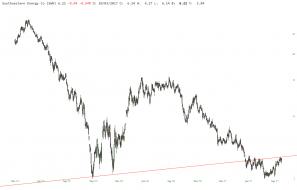
So we are back to the bubble highs from 2005 for housing stocks - which proved to be of no signaling potential for...
1
slopechart_SWN (3).jpg
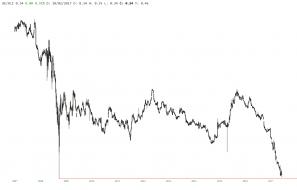
Energy rallies sends SWN to underside of trendline going back to 1999.

slopechart_GE-XLI.jpg
Ratio of GE to industrial ETF (XLI). Approaching 2008 low.
slopechart_CEW.jpg
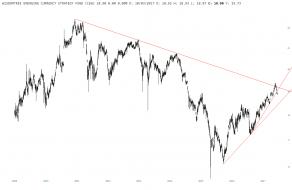
Dollar correction over. China to cut RRR, can't take the liquidity squeeze.