Date: April 5, 2018
4 apr4.PNG
RESTACK
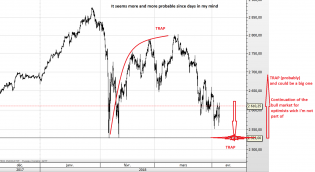
I guess that's my scenario as long as June futures stay below 2675


1 apr6.PNG
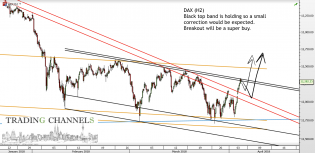
daxH2log.png
Chart of the day is $DAX at www.tradingchannels.uk

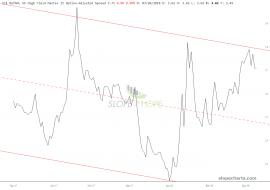
slopechart_FR_BAMLH0A0HYM2 (1).jpg
BofAML US High Yield Master II Option-Adjusted Spread failed to drop despite yesterday's monster rally.

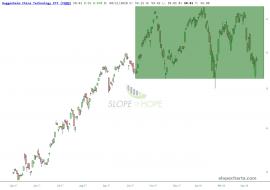
slopechart_CQQQ.jpg
China Tech. Double cursed.
1

Screen Shot 2018-04-05 at 11.20.41 AM.png
The *problem* with the MJ chart is...nothing to the left of 26Dec is relevant, as prior to then, the ETF was a di...


paragon2.jpg (835×624)
SF real estate appreciation
1

paragon san fran vs US.jpg (835×625)
SF Housing Prices
1
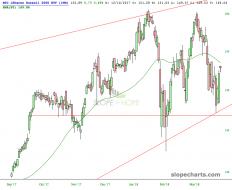
slopechart_IWM.jpg
Closer look IWM

2
slopechart_IWM.jpg
Russell 2k looks pretty vulnerable and is leading the bounce up to the 50 day
1
4 apr5.PNG

3 apr5.PNG
2 apr5.PNG
2