Date: August 27, 2018

nikkei-index-attempting-22-year-breakout-aug-27.jpg (1235×661)
2

slopechart_$BTC.jpg
Price is above the midpoint of the Bollinger Bands and the 200 day is turning up but a test of the long term trendlin...

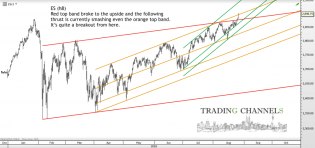
Chart of the day – Trading Channels
Chart of the day is ES (sp500) at www.tradingchannels.uk


km5pa2mmlei11.png (900×890)
Caviar chart!
1