Date: January 22, 2018
wtiH2log.png
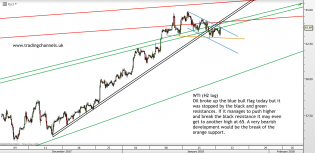
Chart of the day is #OIL at www.tradingchannels.uk

1

20180122_EOD12.jpg (890×448)
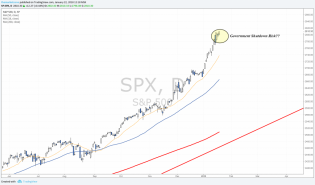
2Y Treasuries now yield 27bps more than the S&P 500...the most in 10 years...
2

http://www.tradegato.com/gallery/albums/TradeGato/YM-03-18-240-Minu...
01/22/2018 Swing Trade Chart

weekly markets analysis
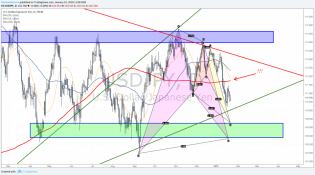
USDJPY - Moving inside Triangle pattern - Two harmonic patterns in focus

Weekly Markets Analysis
SPX failed Outside Bar pattern
Politics and Macro Economics – TheMarketZone
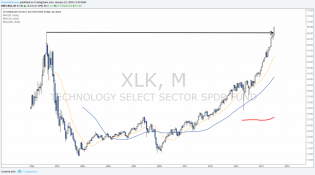
XLK takes out the 2000's tech bubble top