Date: March 5, 2018
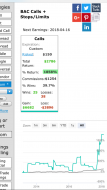
image.png
BAC calls, 7 days to expiry
30 delta, close out at 50% loss

1
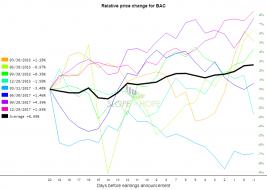
slopechart_BAC.jpg
BAC earnings, 4/17/18
Consider entry on long side on 4/3 (D-14), exit at Day +1

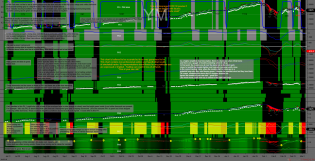
nasdaq-composite-testing-20-year-breakout-march-5.jpg (1569×735)
Nasdaq attempting 20-year breakout, with momentum at 2000 levels
3

2018-03-05_11-23-38.jpg (890×655)
Goldman Sachs' technical analysis team are worried and target a drop to 2,449 for the major US stock index.
http://www.tradegato.com/gallery/albums/TradeGato/YM-03-18-240-Minu...
03/05/2018 Swing Trade Chart
