Date: November 1, 2018
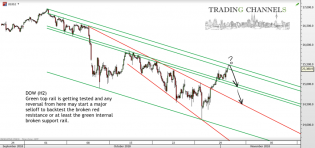
Chart of the day – Trading Channels
DOW

2

s3.amazonaws.com/cdn2.soci..._QpGZlZ_l.png
Posted this USDollar chart on 21 Oct when it had three levels of R to overcome, including a break of an ihs neckline.

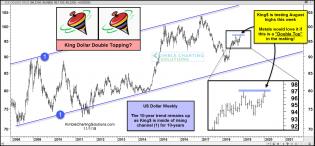
us-dollar-possible-short-term-double-top-nov-1-1.jpg (1574×731)
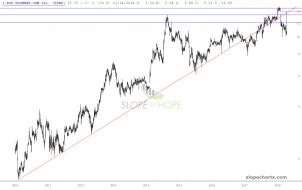
slopechart_FLWS.jpg
FLWS

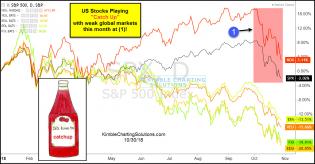
us-stocks-playing-catch-up-with-global-markets-oct-30.jpg (1234×645)
1

SPX-testing-important-support-oct-28-2.jpg (1568×735)

nyse-dual-support-test-in-play-oct-31.jpg (1567×732)