Date: November 22, 2018
slopechart_WFC.jpg
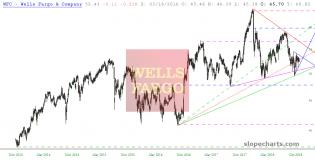
Progressive failure lower. The first failure was the green dash trendline. The second failure was the red dot tren...

1
slopechart_TD.jpg
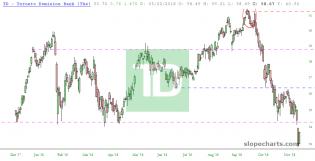
Bearish engulfing at the tippy top. Bullish harami currently at the bottom of this dive. This puppy looks bad.
slopechart_MS.jpg
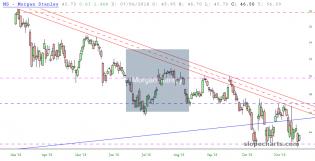
That's mighty close to looking like a triple bottom. I might be tempted long for a scalping opportunity for a buck or 2.

slopechart_JPM.jpg
Candlestick patterns with common stops.
Red - Inverted hammer (gravestone doji)
Pink - Bearish engulfing
Blue -...
1

slopechart_HDB.jpg
Nothing special here. Odd candle from from 11/21. The red horizontal represents the gap up from May and also the g...
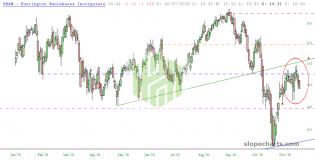
slopechart_HBAN.jpg
Evening star almost perfect rejection off the bottom of failed bull trendline. I'm thinking buying the 14P can't b...
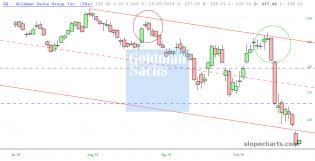
slopechart_GS.jpg
Another bearish engulfing on one top and the elusive and rare 3 strike bar on another.
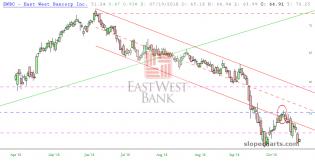
slopechart_EWBC.jpg
Hanging man candlestick followed by fall back below the bearish trendline. I would be looking for a bounce back to...
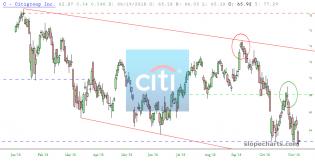
slopechart_C.jpg
Bearish engulfing at one top. Bearish harami at another. Both with follow through.
slopechart_$ETH.jpg
ETH loses support and heads toward 97.66.

2
slopechart_$BTC.jpg
The crypto collapse continues to consume capital as Bitcoin makes new yearly lows.
2
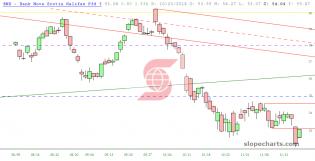
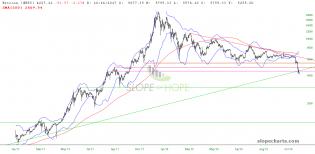
slopechart_BNS.jpg
NR7 bearish breakout. Target of 51.72 not hit yet.
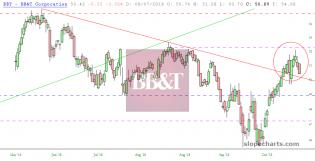
slopechart_BBT.jpg
An almost perfect bearish fractal. Coming at a retest of breakout of bearish trendline. Worth keeping an eye on.
1
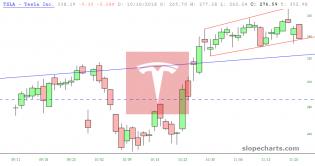
slopechart_TSLA.jpg
Evening star with follow through.
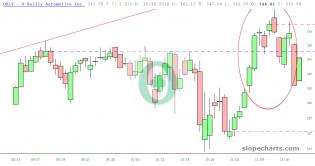
slopechart_ORLY.jpg
Evening star followed by bearish engulfing. That would be another evening star right after but it's not at a top.

slopechart_/GC.jpg
Gold made a series of higher lows and is looking to retest resistance, is it futile ?
1
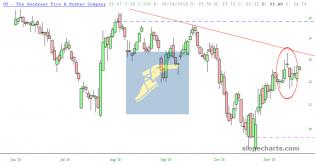
slopechart_GT.jpg
Evening star no follow through.
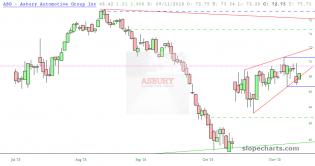
slopechart_ABG.jpg
Triple NR7 pattern with latest breakout lines (blue) and target prices (green dash).
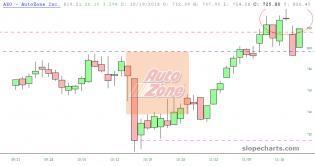
slopechart_AZO.jpg
Evening star no follow through.
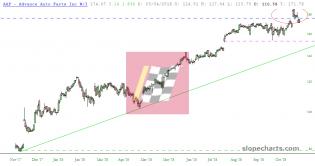
slopechart_AAP.jpg
Bearish engulfing with follow through.