Date: February 3, 2019
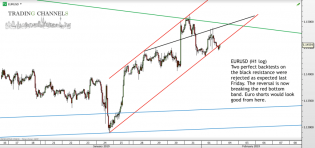
Chart of the day – Trading Channels
EURUSD


Q1 2019 eps growth rate.jpg (809×470)
1

2019-02-03 (1).jpg (890×484)

slopechart_SEDG.jpg
Maybe a buyout candidate? Or if black gold goes up, so does this? No real company or industry research ideas wer...


Household-Equities-DPI-020119.png (890×440)
There is no longer a “pent up” demand for equity ownership as households now have more equity exposure than at...
1
s3.amazonaws.com/cdn2.soci..._eZ8rAv_l.png
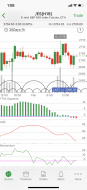
Momentum weakening (declining adx), in TTM squeeze and overblught by RSI. Headed downward?

1

NDXW2-2.png (890×588)
2000 and 2018
1

BPSPX-2_0.png (890×788)
$BPSPX RSI is now the most overbought since January 2018 before the 10% February correction: