Date: March 10, 2019
slopechart_XLP.jpg
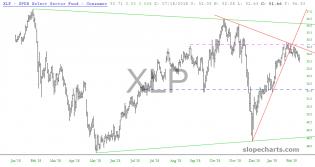
Triangle breakout to the downside.

slopechart_XRT.jpg
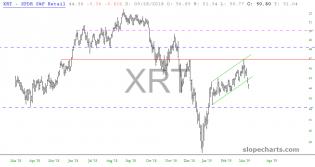
XRT hits overhead resistance and falls through channel support.
1

jtmyrtyqmcl21.png (1125×1125)
2
SLVpatternbreakouts.png
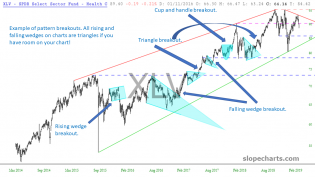
More chart art showing pattern breakouts in XLV.

s3.amazonaws.com/cdn2.soci..._b7wjN3_l.png
Indicators-Smindicators
These three would of had you in FAZ on 4Mar.

3
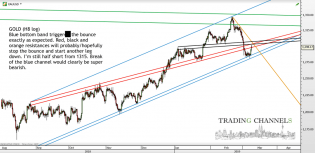
Chart of the day – Trading Channels
GOLD


slopechart_SPY.jpg
Some obvious patterns on the SPY 5Y D chart I am starting to see now without looking hard.
1