Date: March 16, 2019
slopechart_HLF.jpg
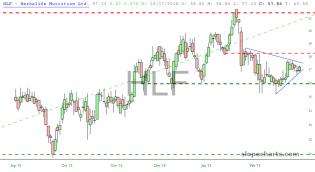
Thought it was a goner, but after a double bottom bounce it looks like we have a turnaround. With an up day tomorr...

slopechart_FLR.jpg
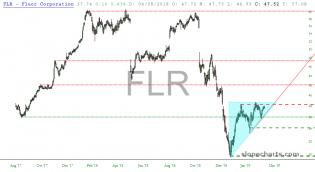
It looks like the old support line is going to hold. Waiting for a close above red resistance to initiate long position.
1
slopechart_FCX.jpg
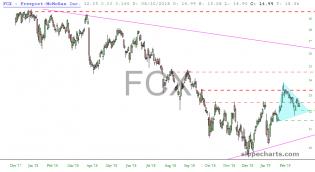
Bullish or bearish depends on breakout direction from triangle. Rounded bottom bullish breakout followed be retrac...
slopechart_SPY,USO.jpg
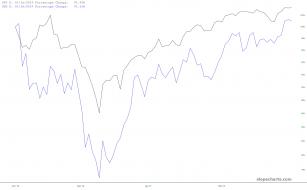
Equities and oil pretty much in lockstep for several months now


slopechart_DWDP.jpg
Here's another one you can play the breakout long or short. I'm leaning long.
slopechart_CTRP.jpg
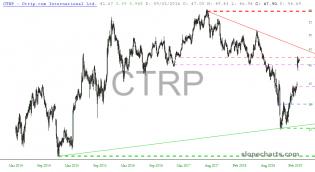
After the earnings gap up, price has spent the past 2 weeks consolidating. I will play a close outside of pink and...
slopechart_CHRW.jpg
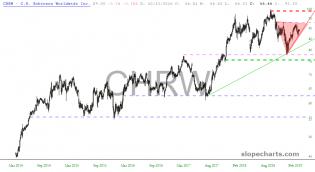
You can play the bullish break of the top or the bearish break of the bottom. This has that topping pattern look t...
slopechart_MS.jpg
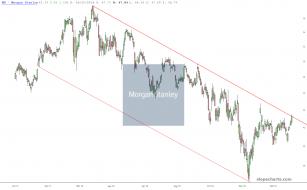
MS testing the upper channel line, looks like it closed just a tad above it.
2

slopechart_AEM.jpg
Triangle bullish break on a gold miner.
1

slopechart_TSLA.jpg
Is that falling knife going to cut through that bullish trendline? Tune in next week to find out!
slopechart_LEA.jpg
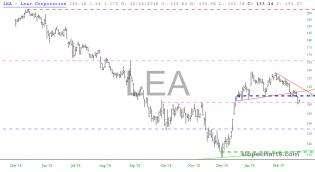
Mini top support broken to the downside along with bullish trendline failure. Attractive to short as there is noth...