Date: March 8, 2019

GDXfibarc.png
GDX mysteriously found a bottom? NO! The magic of the fibonacci arc!

1
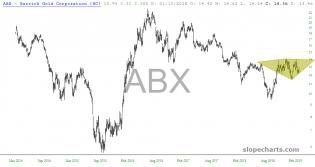
slopechart_ABX.jpg
Slightly convex diamond pattern in ABX
1
ABXchart030819.png
A fun little quiz to start the weekend. If you look hard the diamond started in mid October.
1

slopechart_/GC.jpg
I will be surprised if /GC doesn't tag the 200 day before making an all out assault on the upper band of resistanc...

1

outflows since oct_0.jpg (669×456)
1

worst outflows since 2008.jpg (627×503)
2019 is now the worst start to year for equity outflows since 2008

japan rallies bofa.jpg (890×450)
Japan "enjoyed" no less than 13 rallies that exceeded 20% during its secular bear market years from 1990 and 2003...
2

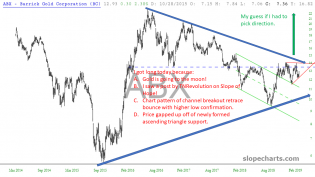
s3.amazonaws.com/cdn2.soci..._PFY6V4_l.png
Nice looking chart on ABX.
We should have bought above both purple lines in Sept and Oct.
Green lines are the...

4

gold cot
Although the large specs sure have scattered after the bull horns did their damage. https://nftrh.com/2019/03/01/gold...


silver cot
Silver CoT not yet in line for a low risk bull scenario.

Gold and Silver CoT Finally Up to Date; Correction Over? Maybe N...
Gold CoT not yet in line for a low risk bull scenario.
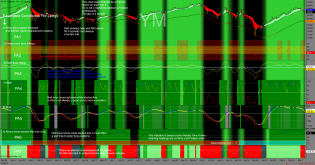
http://tradegato.com/gallery/albums/TradeGato/50_Shades_Of_Green_Wi...
YM 03/08/2019


Next Chart
Sludge


D1KHwENX4AMIrEQ.jpg:large (1666×1105)
1
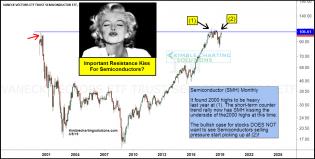
semiconductors-kissing-resistance-2000-highs-march-6.jpg (1266×641)

10-year...

joe-friday-nyse-rollovers-starting-to-take-place-mar-8-1.jpg (15...
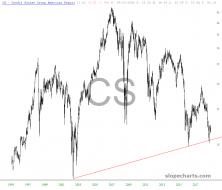
slopechart_CS.jpg
Who will extend them Credit?
1