Date: May 1, 2019
slopechart_$ETH.jpg
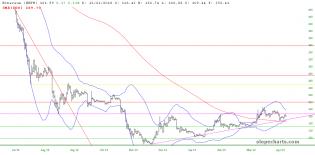
Ethereum is taking on the character of an ascending triangle with a target at about $250


c0uen4us6gv21.png (826×756)
4

doc-copper-weak-of-last-suggesting-slower-times-ahead-may-1.jpg...
1
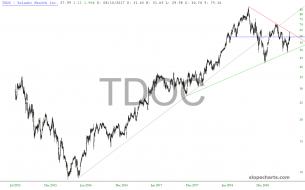
slopechart_TDOC.jpg


slopechart_CHRW.jpg
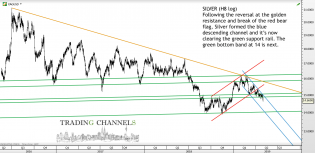
silverH8log
SILVER

2
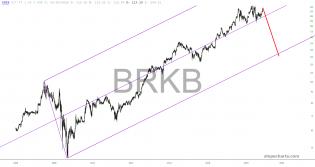
slopechart_BRKB.jpg
Slow and Steady wins the race

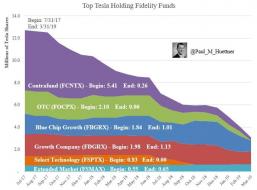
tsla.jpg (692×510)
3
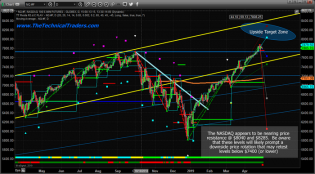
How Close Are The Markets From Topping? – Technical Traders Ltd.

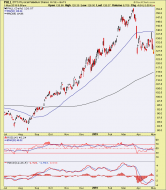
platinum
Platinum long position somewhat under threat but still viable for bottom, so holding on.

palladium gold ratio
PALL/Gold not looking good and this is a (one of many, so calm down) macro indicator that is not pleasant for the bulls.
palladium
Palladium continues its breakdown. This thing flew with the stock bubble every step of the way.
FOMC: 06.38.30 – Notes From the Rabbit Hole
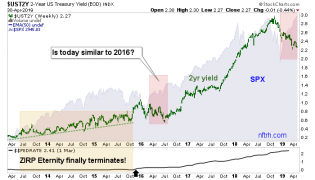
So, is the 2yr/SPX relationship going to get back in line (stocks tank) or is SPX right again, as it was in 2016?

FOMC: 06.38.30 – Notes From the Rabbit Hole
Why was the Fed hawkish in Q4 despite an imploding stock market and dovish now despite a manic bullish one? Simple...
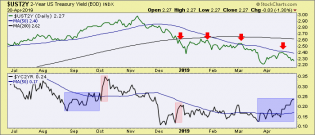
2 year yield and yield curve
2yr yield has been leading the dovish Fed while the yield curve gets peppy as it did into late Sept.
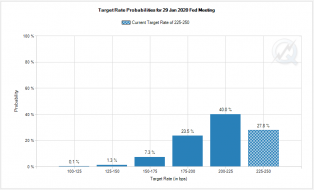
FOMC: 06.38.30 – Notes From the Rabbit Hole
CME Group: Growing probabilities of rate cut into January.
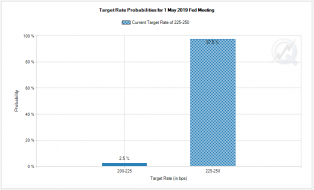
FOMC: 06.38.30 – Notes From the Rabbit Hole
CME Group: no rate hike today. Duh.
1