View: GS_Daily_June102015.jpg
GS_Daily_June102015.jpg
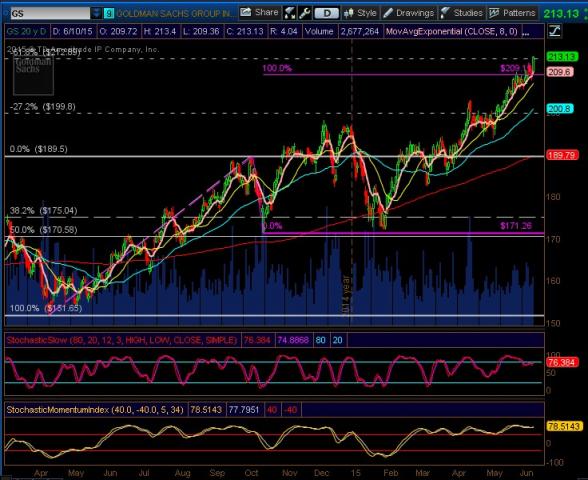
I'm going to tempt the wrath of the market gods with this one (I know you're paying attention Goldy!)
From a purely technical perspective, GS is at an extreme bullish point.
The case for being bearish Goldman:
1. AB=CD off the April 2014 swing low completed (209.10)
2. 1.618 fib projection off that April 2014 swing low completed today (June 10th) at 212.89
3. We have short-term slow stochastic divergence on the daily (12,3 setting) with a drop under extreme bull level (80+ is extreme).
4. Medium term momentum as measured by the 34,5 period SMI is also showing some divergence, but is still in extreme bullish range (40+)
5. On the Monthly chart, fib pattern traders could argue that goldy has completed a Gartley pattern.
Either way, I would not be adding to long positions (at the very least). I would be watching for price action to tell us it's time to short.
Comments
No comments yet.

