Source: screencast
Below are all items from screencast.

2018-10-10_0758.png (1561×708)
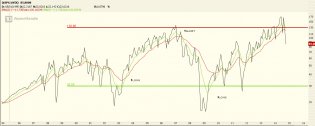
Greenbuckeye posted this amazing DAX top
1

content.screencast.com/use.../VIX12315.jpg
Key level approaching in the VIX.

1
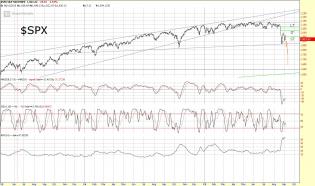
content.screencast.com/use...SPX111315.jpg
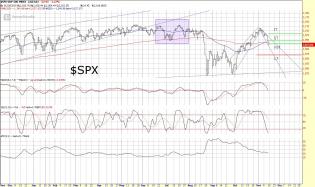
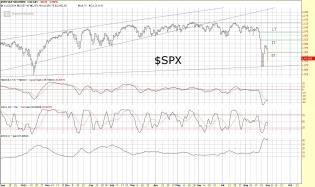
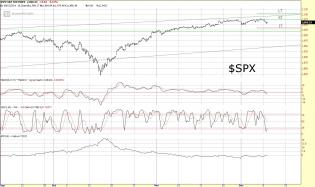
Updated SPX Reversal Levels.
VST Sell, ST Sell, IT Sell, LT Buy. Seeing some similarities to the mid-July move.
1
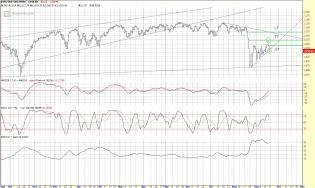
content.screencast.com/use...SPX103115.jpg
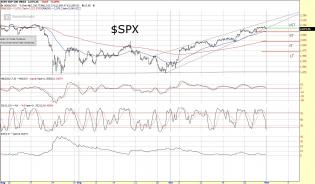
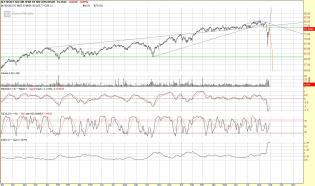
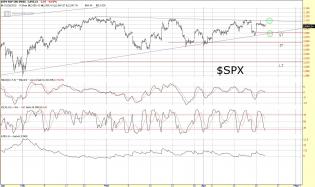
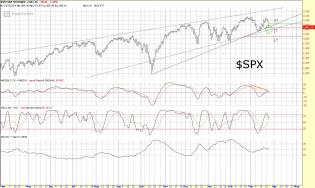
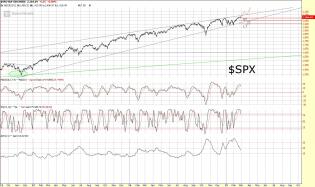
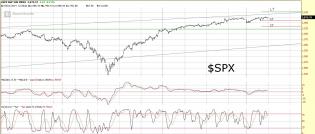
$SPX Reversal Levels
Very Short Term Sell, Short Term Buy, Intermediate Term Buy, Long Term Buy.
1
content.screencast.com/use.../SPX10915.jpg
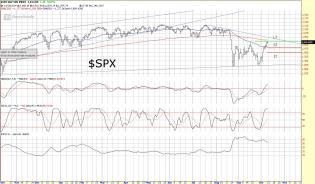
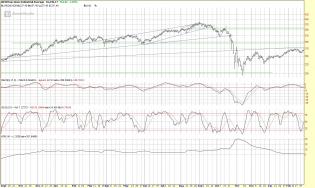
$SPX Daily Chart
Reversal levels are currently on a short term buy, intermediate term buy, and long term sell....
3
content.screencast.com/use...929Analog.gif
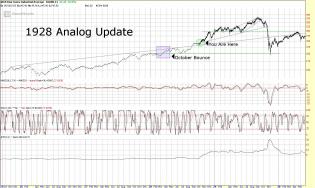
1929 Analog Update
content.screencast.com/use...%20Update.jpg
Analog Update
1
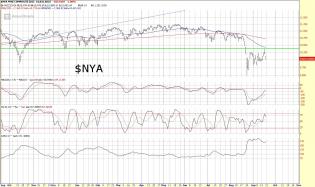
content.screencast.com/use.../NYA91815.jpg
Beautiful technical look at the $NYA
The green horizontal line is the 2007 top, which the $NYA now has a failed...
content.screencast.com/use.../SPX91815.jpg
Update $SPX Reversal Chart
SPX reversed back to a short term sell today, putting all three timeframes on a sell...
2
content.screencast.com/use...1/SPX9415.jpg
Game plan for next week. Have a great three day weekend!
1
content.screencast.com/use...a/SPX9115.jpg
Update reversal levels for SPX.
Short term reversal higher tomorrow would be above 1950. Below that, I highly...
1
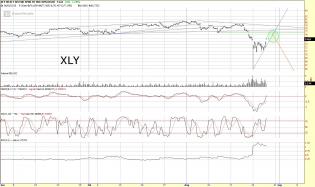
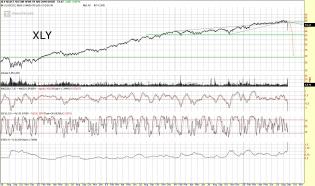
content.screencast.com/use.../XLY82815.jpg
Put up or shut up time.
Years of research on 1929, and there is the setup staring you straight in the face. Do...
content.screencast.com/use.../XLY82715.jpg
As of this morning, out of all longs I that I don't want to hold for the long term. When this trendline breaks, I...
2
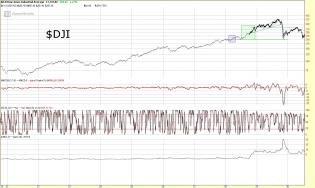
content.screencast.com/use...b2bd/1929.jpg
1929 DJI
content.screencast.com/use...84e97/XLY.jpg
Tim, here's the scenario 3, the crash scenario I was talking about. Compare it to the 1929 chart, I'll post next.
1
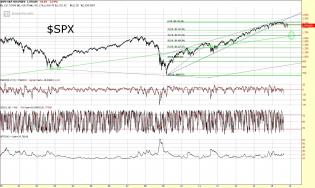
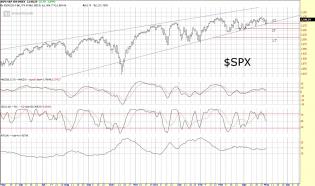
content.screencast.com/use.../SPX82315.jpg
$SPX Long Term Chart
If the market is indeed setting up to rollover off this year's top, I would suggest the 15...
2
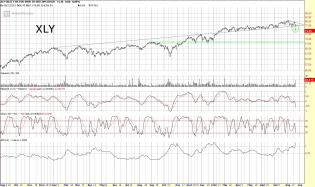
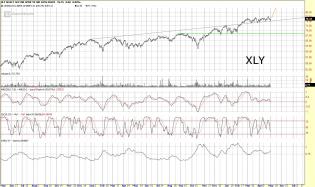
content.screencast.com/use.../XLY82215.jpg
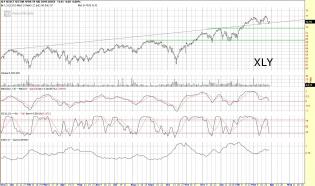
XLY Daily Chart
The trendline on XLY that I've been watching all year ruptured on Friday. As a result, I got s...
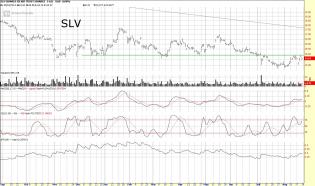
content.screencast.com/use...904d/SLV1.jpg
SLV Daily Chart
One thing that has been working swimmingly over the past month has been precious metals, and in...
1
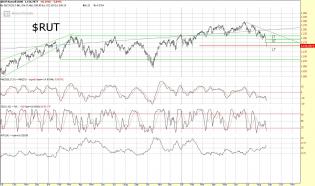
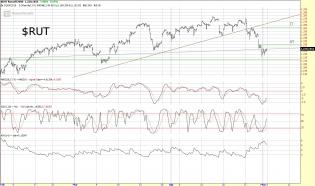
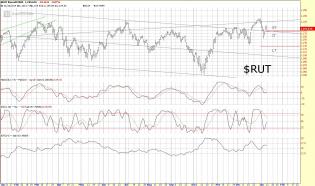
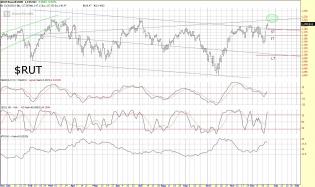
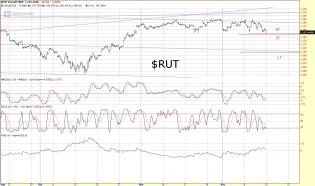
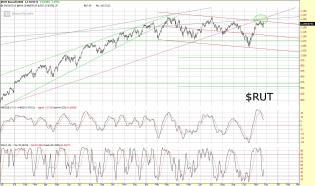
content.screencast.com/use.../RUT82215.jpg
$RUT Daily Chart
Wild week, eh? Congrats to the bears who profited. I'll get the next one, promise. ;) Until...
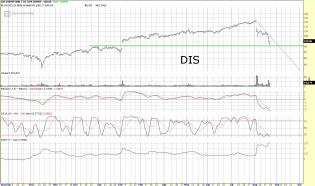
content.screencast.com/use.../DIS82115.jpg
DIS Daily Chart
1
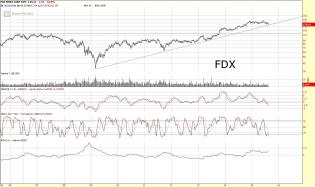
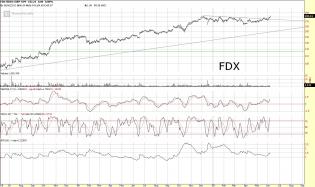
content.screencast.com/use.../FDX82115.jpg
FDX tagging trendline this morning off the 2009 low.
1
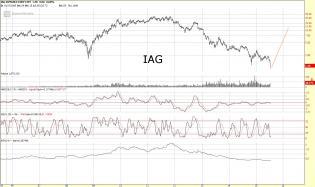
content.screencast.com/use.../IAG72415.jpg
IAG Weekly Chart.
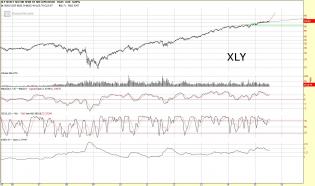
content.screencast.com/use.../XLY72415.jpg
XLY Weekly Chart.
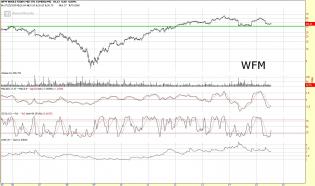
content.screencast.com/use.../WFM72415.jpg
WFM Weekly Chart.
A buy above 35.
content.screencast.com/use...c/FDX6515.jpg
FDX Daily Chart
1
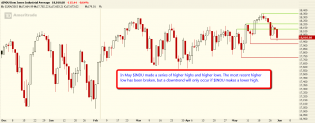
http://content.screencast.com/users/Jim_Nf6/folders/Jing/media/0b1a...
I don't see a fish. I see higher highs and higher lows in a range.

3
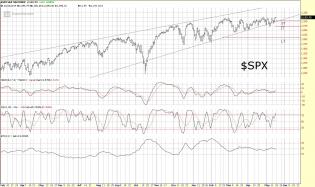
content.screencast.com/use.../SPX51515.jpg
$SPX Daily Chart
Wedge still holding. On a buy on all timeframes, testing a breakout to new highs.
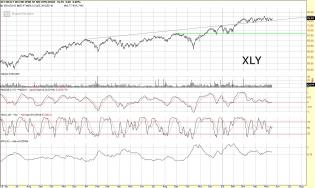
content.screencast.com/use.../XLY51515.jpg
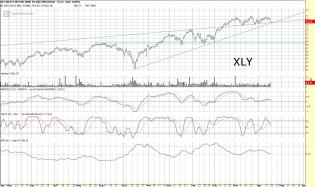
XLY Daily Chart
Breakout support still holding. Could start a new upleg higher at any time.
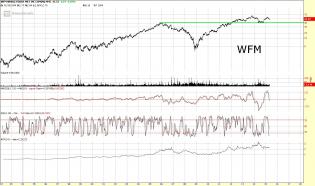
content.screencast.com/use...9/WFM5615.jpg
Here's betting it never drops below that green line this year. I'll be buying the dip when it turns up.
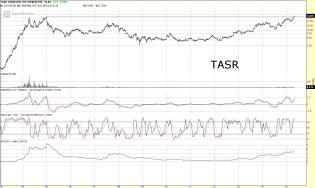
content.screencast.com/use.../TASR5515.jpg
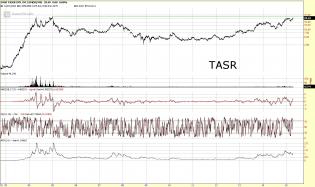
TASR Weekly Chart
If that's not a beautiful chart, I don't know what is.
2
content.screencast.com/use...4/RUT5115.jpg
$RUT Hourly Chart
Some damage was done to the Russell this week, as it showed the most weakness of the major in...
content.screencast.com/use...3/SPX5115.jpg
SPX Daily Chart
Wedge support continues to hold for SPX. It remains on a buy on all three timeframes.
content.screencast.com/use...2/XLY5115.jpg
XLY continues to hold it's breakout support. I continue to expect higher prices and market leadership here.
content.screencast.com/use...928Update.jpg
1928 Analog Update
content.screencast.com/use.../SPX42215.jpg
The view from here... Key areas circled in green.
content.screencast.com/use...TASR41715.jpg
A long term look at TASR. Really pretty pattern.
content.screencast.com/use.../XLY41715.jpg
XLY Daily Chart
I think that chart about sums it up.
content.screencast.com/use.../XLY32715.jpg
XLY Daily Chart
If the market doesn't start to fall apart next week, Consumer Discretionary is probably going t...
content.screencast.com/use.../SPX32515.jpg
Pretty significant reversal today across all indices. SPX closed below its October trendline, after bouncing off...
2
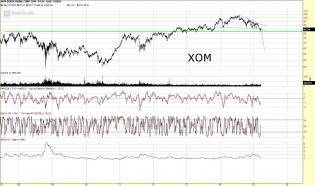
content.screencast.com/use.../XOM32215.jpg
Exxon looking very vulnerable there. I have no position in the stock, but would happily buy some on a major washo...
2
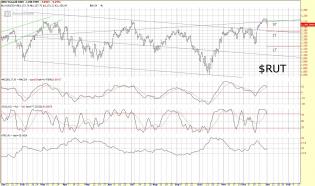
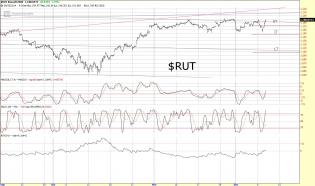
content.screencast.com/use.../RUT31615.jpg
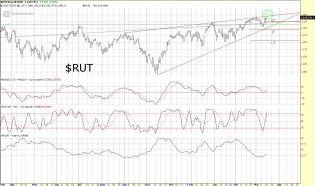
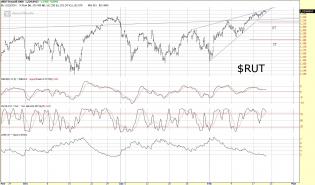
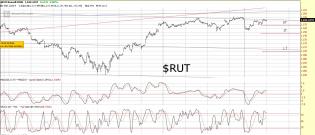
Updated $RUT Daily Chart
After successfully backtesting the breakout of the 1212 level, the Russell has continu...
content.screencast.com/use...a/RUT3615.jpg
$RUT Daily Chart
Here's your TnR weekend update. The Russell finally got a short term sell reversal this week,...
1
content.screencast.com/use.../SPX22715.jpg
$SPX Daily Chart
The view from here.
content.screencast.com/use.../RUT21915.jpg
$RUT Hourly Chart
From a charting perspective, easy to see why this has been a boring week, as we're at the top...
3

content.screencast.com/use...4d/Letter.jpg
This was hilarious.
2
content.screencast.com/use.../RUT21315.jpg
$RUT Hourly Chart
The Russell continues to perform beautifully, from the bullish perspective. The rise that be...
3
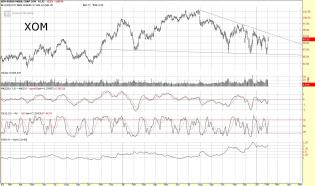
content.screencast.com/use...e/XOM2415.jpg
Here's what my XOM chart looks like. Whichever of the two trendlines breaks should yield a nice move. I would le...
1
http://content.screencast.com/users/Jim_Nf6/folders/Jing/media/721b...
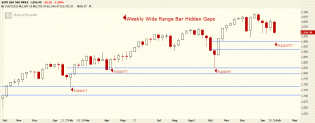
$SPX weekly wide range bars with hidden gaps act as support
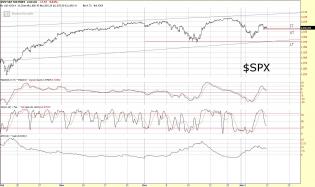
content.screencast.com/use.../SPX13015.jpg
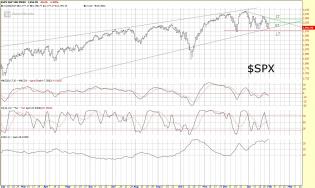
$SPX Daily Chart
Nice clean chart with good reversal levels either way, I like it. The good news is this 2 mon...

content.screencast.com/use.../RUT12815.jpg
$RUT Hourly Chart
Starting to get a bit more interesting in bearland, eh? Today's action moved the Russell to...
3
content.screencast.com/use.../ADP12315.jpg
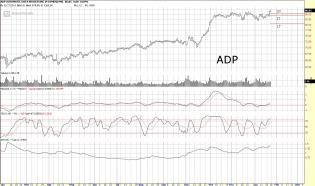
ADP Daily Chart
Another long idea from the Rev? Some good individual opportunites inside the Russell, ADP bein...
1
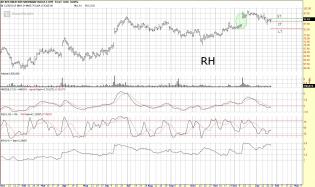
content.screencast.com/use...6/RH12315.jpg
Baby, go buy yourself something nice. The money printers are still on, and the upper-middle class is feelin' thei...
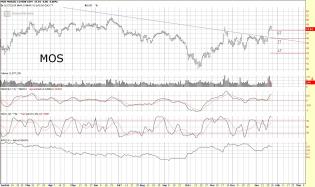
content.screencast.com/use.../MOS12315.jpg
MOS Daily Chart
Let's take a look at how to use reversal levels on different timeframes to time entries into ne...
1
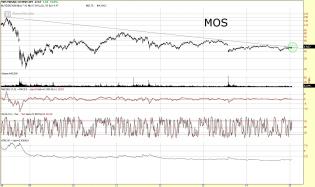
content.screencast.com/use.../MOS12015.jpg
MOS Daily Chart
Keep an eye on TNH and MOS, both up big today. No crap! MOS breaking out of 6 year downtrend.
content.screencast.com/use.../RUT11615.jpg
$RUT Hourly Chart
The Russell broke through to a short term buy reversal this afternoon. It remains on a long...
2
content.screencast.com/use...1/SPX1915.jpg
$SPX Hourly Chart
Update ST and IT reversal levels. ST Buy, IT Buy, LT Buy
The ST and IT reversal levels have...
content.screencast.com/use...6/RUT1915.jpg
$RUT Daily Chart
Updated ST and IT reversal levels. ST Buy, IT Buy, LT Buy.
ST and IT have clustered together...
1
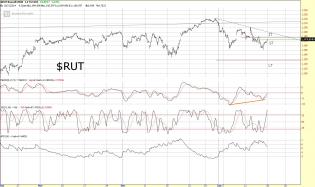
content.screencast.com/use...f/RUT1215.jpg
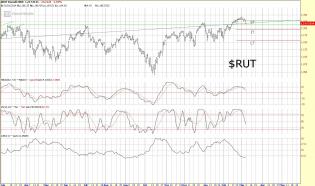
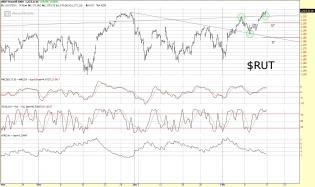
$RUT Daily Chart
Updated ST, IT, LT Reversal levels. Currently on a short term sell, intermediate term buy, lo...
2
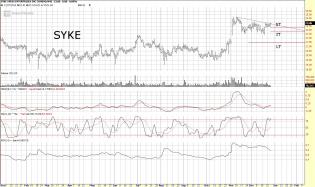
content.screencast.com/use...YKE122614.jpg
SYKE Daily Chart
Here's a tasty long setup for your weekend viewing pleasure. I've been stalking this one for...
content.screencast.com/use...928Analog.jpg
Since I'm bored this weekend, and really like charts... I went ahead and put together rough outline of what a 1928...
1
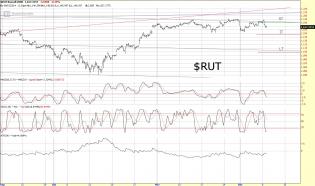
content.screencast.com/use...RUT121914.jpg
$RUT Daily Chart
Just one chart this week to look at. I'll be gone most of next week. Updated intermediate an...
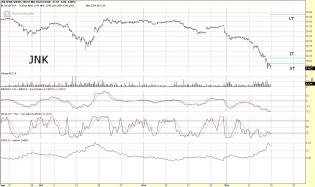
content.screencast.com/use...JNK121214.jpg
JNK Hourly Chart
Probably the most important market to watch for the next few weeks/month... If we can see a r...
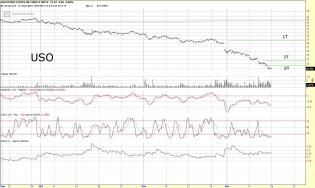
content.screencast.com/use...USO121214.jpg
USO Hourly Chart
Updated short term and intermediate term reversal level. USO continues to be the primary driv...
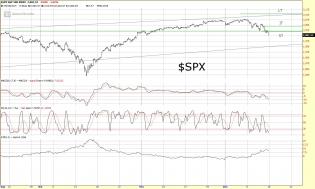
content.screencast.com/use...SPX121214.jpg
$SPX Hourly Chart
Updated short term and intermediate term reversal levels. $SPX continues to show the weakest...
content.screencast.com/use...RUT121214.jpg
$RUT Hourly Chart
Updated short term & intermediate term reversal levels. Of the major indices, the RUT continues...
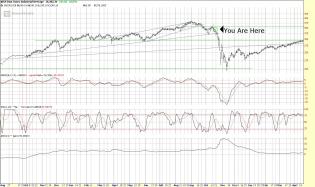
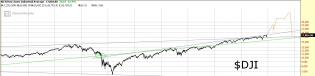
content.screencast.com/use...d/DJI1928.jpg
Are we here?
The previous record for consecutive days above the 5DMA is show in the purple box. What followed...
content.screencast.com/use.../RUT12914.jpg
$RUT Hourly Chart
Amazingly enough, the Russell reversed hard back higher today, and reversed back to a buy on...
content.screencast.com/use.../RUT12814.jpg
$RUT Hourly Chart
Today's selloff moved the Russell to a short term sell. Chart continues to look rather chopp...
2
content.screencast.com/use.../SPX12814.jpg
$SPX Hourly Chart
Today's selloff moved SPX to a short term sell. The chart still looks relatively choppy in h...
content.screencast.com/use...7/SU12514.jpg
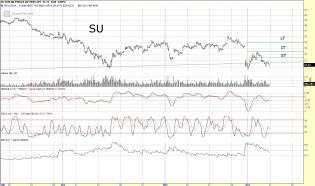
SU Hourly Chart
Best short among the oil majors? It may be. I like it as a short over the likes of XOM and CO...
1
content.screencast.com/use.../SPX12514.jpg
$SPX Hourly Chart
Updated ST & IT reversal levels. $SPX is on a buy ST, buy IT, and interestingly still a sell...
content.screencast.com/use.../RUT12514.jpg
$RUT Hourly Chart
Updated ST and IT reversal levels. The Russell remains on a buy on all timeframes.
2
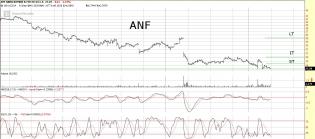
content.screencast.com/use.../ANF12514.jpg
ANF Hourly Chart
Updated IT and ST reversal levels. Got short today via the Jan puts. Hat tip to TK!
3
content.screencast.com/use.../RUT12314.jpg
Updated $RUT chart with reversal levels.
Still on a buy across the board.
content.screencast.com/use.../RUT12114.jpg
Updated RUT Chart
Here's what the updated $RUT chart looks like with the current Average True Range reversal si...
1
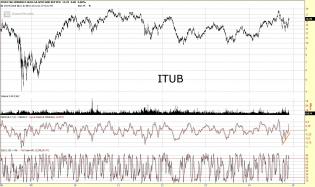
content.screencast.com/use...TUB112614.jpg
I really like what I'm seeing taking shape in Brazil. I good example of an individual name to get long it ITUB....
3

content.screencast.com/use...SPX112614.jpg
Time to start building the case for the start of a possible parabolic move higher. Here's the daily chart of $SPX...
1
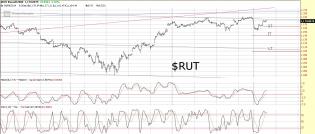
content.screencast.com/use...RUT112114.jpg
Here's what my RUT daily chart looks like. I would say I'm neutral on it at the moment. In spite of the strength...
content.screencast.com/use...RUT111914.jpg
Well, the bears finally got the stones up to take back control of the Russell, with today's move back under 1159....
1

content.screencast.com/use...JGB111214.jpg
Selling in JBGs continued overnight, beginning to intensify a bit, as the trendline off the 2013 low was tested.

content.screencast.com/use...bd26/JGB2.jpg
JGB futures chart, since the May 2013 selloff in JGBs. Notice the failed breakout from the point where it started...

content.screencast.com/use...70a6/JGB1.jpg
JGB futures daily chart.

content.screencast.com/use...per103114.jpg
For the cat and Frenchy, here's my take on the long term copper chart. It topped in 2011, after a failed breakout...

content.screencast.com/use...SPY103114.jpg
I heard a lot of talk yesterday about the hanging man candles on the daily and monthly charts. To say that Novemb...
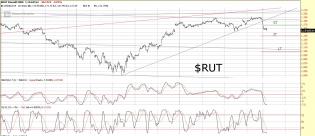
content.screencast.com/use...RUT103114.jpg
No more pretty bearish forecasts, just an honest look at a long term RUT chart. If you step back and look at a 15...
1

content.screencast.com/use...son103114.jpg
Hourly Comparison Chart
While $SPX is currently challenging its Sept high, TLT and EEM remain with noticeable d...

content.screencast.com/use...SPX102914.jpg
$SPX trendline break.

content.screencast.com/use.../POMOland.jpg
Trying to make a good use of my time waiting for the bear to resume.
3

content.screencast.com/use...omparison.jpg
$SPX vs EEM & USO. Spot the divergences.
1
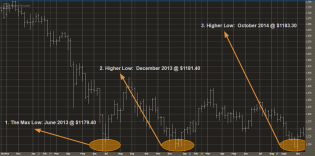
2014-10-25_2148.png (1034×515)
Consecutive Higher Lows = Triple Bottom Reversal Pattern


content.screencast.com/use...CrashLine.jpg
Here's a key trendline to watch in the months ahead. The green trendline shown originates from the SPX top in 198...
1

content.screencast.com/use...SPX102414.jpg
The updated SPX 1929 analog would look something like this. Currently it's on about a 2x timescale to 1929 if the...
2

content.screencast.com/use...SPX102314.jpg
Revised $SPX forecast
Looking for this bounce to end in the next few days, followed by larger decline into Than...
1

content.screencast.com/use...X102014II.jpg
$SPX back to the Aug low.

content.screencast.com/use...SPX102014.jpg
Get the blowtorches out. How's that for a comment?
4
http://content.screencast.com/users/Jim_Nf6/folders/Jing/media/ca23...
Getting close to shorting
2

content.screencast.com/use...SPX101614.jpg
A breakdown of this trendline, and a move today or tomorrow under 1820 SPX would be my signal to get back short....
content.screencast.com/use.../ES101514.jpg
5...

content.screencast.com/use...SPX101314.jpg
$SPX will plunge under this down sloping trendline.
1

content.screencast.com/use...SPX101014.jpg
$SPX Daily Chart
Very interesting chart now. 1900 has become critical short term support for SPX. A break bel...
3