Source: slopeofhope: Brave New World Series 4 – The Next Big Resistance Levels | Slope of Hope#more-18125
Brave New World Series 4 – The Next Big Resistance Levels | Slop...
SHJ
This is the fourth weekend post in my Brave New World Series (BNW Series) since SPX broke over major long term resistance under 1600. There will be at least two or three more in the series after this one. These take quite a bit of work to put together so I’ll be posting the others intermittently over the rest of the year. The previous posts in this series can be found at the links below:
Brave New World Series 1 – Secular CyclesBrave New World Series 2 – Fleas and FibonaccisBrave New World Series 3 – The Rising Wedge Target at 1965
SPX had a very strong week last week and most of the US equity indices are close to testing the highs (SPX, INDU, TRAN, WLSH, SPXEW) or have already broken to new highs (RUT, NDX). Only NYA is still some distance below testing the highs and I’m expecting that to catch up soon.
Assuming that we are seeing big double-tops forming on SPX and other US indices, and I’m leaning strongly against that at the moment, then the next question is where the next resistance is likely to be found. I was looking in my first BNW Series post at the big secular bear market patterns on various indices and highlighted that both INDU (Dow) and TRAN were close to testing their secular bear pattern resistance levels, and that these are representative of the next big resistance levels to be reached on the many indices that I am looking at today. On TRAN I have that likely resistance in the 6850-7000 area so the rise from the June low has come about halfway to towards that target. TRAN weekly chart since 1980:

On Dow likely resistance seems to be in the 16250-500 area, so again the rise from the June low has come about halfway towards that target. Dow weekly chart since 1980:
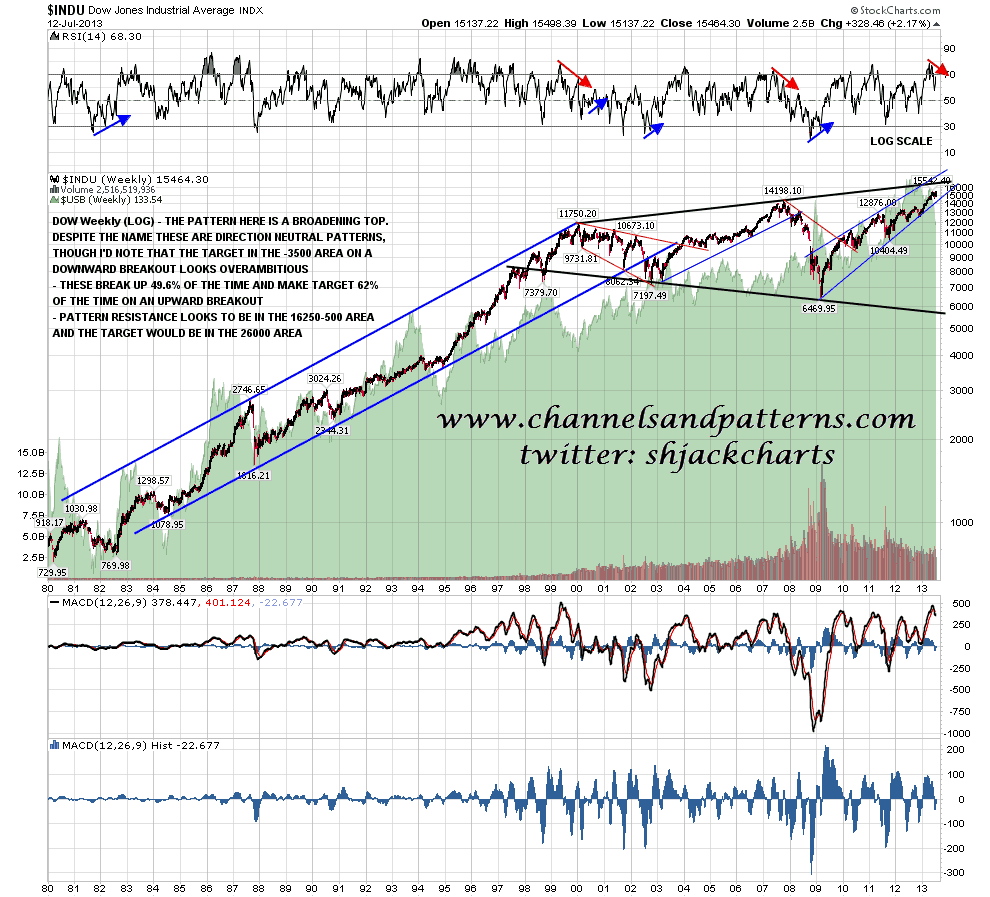
I’m expecting these targets on Dow and TRAN to be hit on this move up, and have a string of international charts to support the proposition that the move from the June low has only covered half or a bit more than half of the move into the next big resistance levels, and to support the further proposition that we might well see a big reversal there.
First the MSWorld (ex USA) where there is broadening wedge resistance and a rectangle target in the 1860-80 area. There is possible resistance here too of course from broken rising support but as soon as that is recovered the target looks obvious and MSWORLD is about halfway back to that target. MSWorld chart from 2007:

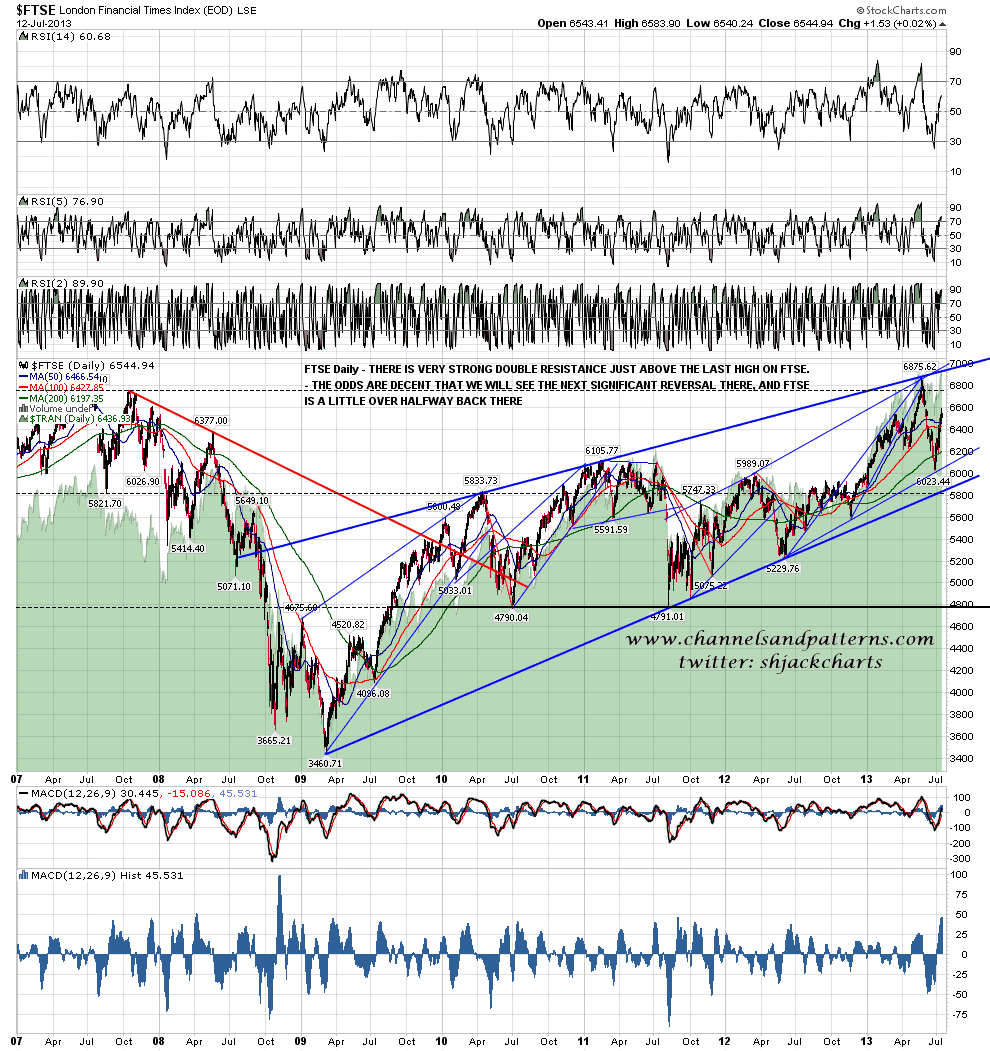
Second the FTSE 100, where there is very clear double resistance in the 6900-7100 area from rising wedge resistance from the 2009 low and rising channel resistance from the spring 2012 low. Unless we are to see this monster wedge break up, that is the likely end for this current move up. FTSE daily chart from 2007:
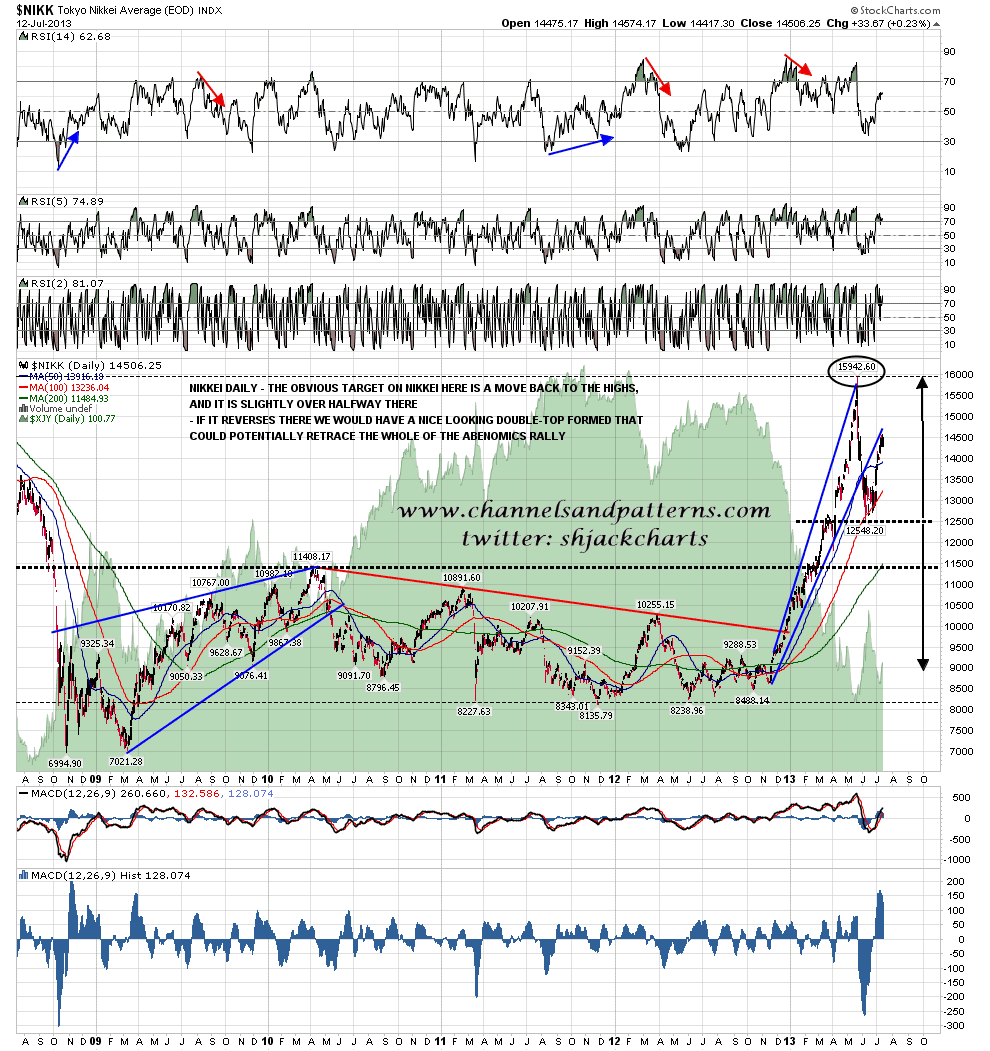
Third the Nikkei, where the first top of a possible double-top has been made. Nikkei is slightly more than halfway back to a test of the highs and there is obvious resistance there. In my view Abenomics is only a little more credible than the Easter Rabbit and the Tooth Fairy so I wouldn’t be at all surprised to see a big reversal there. As with MSWorld Nikkei does have to break back over broken rising support which is now close. Nikkei daily chart from 2008:
Fourth the Hang Seng (HSI) where I posted an HSI chart on 26th June on twitter showing the test of strong triangle support from the 2008 low a couple of days previously. HSI reversed strongly there and is now halfway back to to a test of triangle resistance. This triangle is a strong pattern from 2008 and we may well see the next reversal at triangle resistance. HSI daily from 2007:

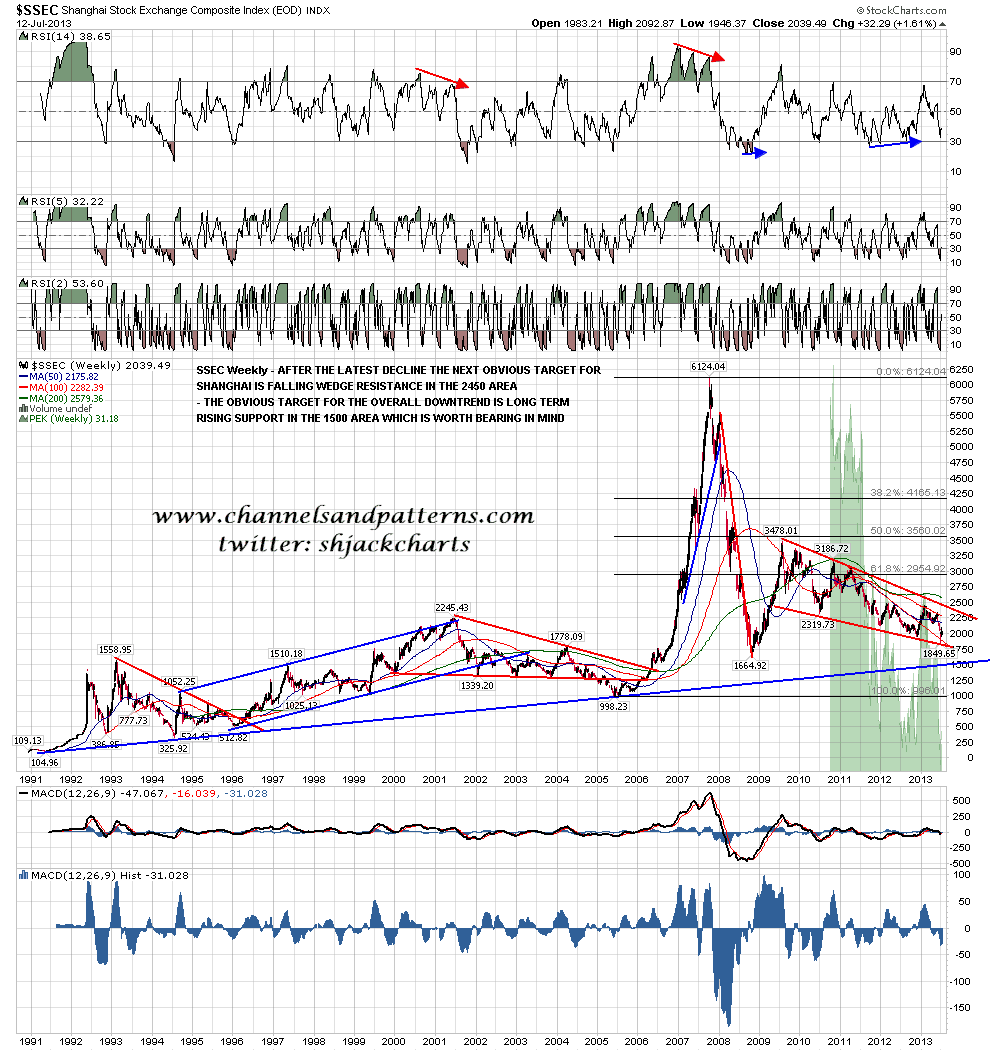
The IHS I was wondering about on Shanghai (SSEC) a couple of months ago didn’t pan out, and SSEC made a marginal new low at falling wedge support from 2008/9. The rally from the low has been weak so far, but for what it’s worth wedge resistance is now in the 2450 area and SSEC is about a third of the way back there. I’m showing the longer term chart here to show why I’m thinking the final SSEC bear market low may not be in until long term support in the 1500 area is hit. SSEC weekly chart from 1991:
So what is the target on SPX? I’ve been giving this some careful thought, and the task is helped considerably by the fact that primary bull market moves on SPX are almost always one of three trendline patterns, either a rising wedge, or a rising channel or a broadening ascending wedge. I demonstrate this in possibly too much detail in my second post in this BNW Series which you can see again here. A primary bull market often only has one pattern but I have seen up to three, with the last example in the 1990-2000 bull market.
A rising wedge has already formed and broken up in this primary bull market from October 2011, and that has a target at 1965. I would expect a second primary pattern to form here now, and though I could be mistaken, I think I already have established trendlines for a primary broadening ascending wedge from the November low. That wedge resistance is currently in the 1750 area and rising, and depending on the speed to this move up from the June low, I would expect that wedge resistance to be hit somewhere in the 1750-1800 area. After that hit I would expect a retracement to test wedge support and then another move up to wedge resistance, which I’m expecting to reach the 1965 area in early 2014.
Just for interest and to show that these three primary patterns are also the most common in lower degrees I have sketched in the lower degree patterns within those primary patterns so far, to show that there have been six next degree down patterns since the October 2011 low, and of those six we have one rising and one falling wedge (both contracting wedges), one rising and one declining channel (both channels), and one broadening ascending wedge and one broadening descending wedge (both broadening wedges). Not enough people appreciate the pure mathematical beauty of these market structures which is a great shame in my view. SPX daily chart from Oct 2011 low:

If SPX were to hit wedge resistance in the 1760-1800 area, then SPX has covered between half and two thirds of the total likely size of this move, which is a decent fit with the other charts above. My feeling is that this is the highest probability path for SPX over the next few months. We’ll see whether this performs as well as the TLT projection I posted in March.
Comments
 Nf6
Nf6
