Source: slopeofhope: ES Quantitative Analysis | Slope of Hope
ES Quantitative Analysis | Slope of Hope
This is a brief post intended to highlight something interesting.
The ES yesterday closed up at 1744, weak bounce so far, not even a dead cat bounce after the dive it did two days ago.
In the chart below you can see the “to go SHORT” and “to go LONG” areas highlighted in red and green.

In this post we will highlight the fact that the odds to go SHORT, on the third day up in a row (today), are quite good around the 1759 level: 68.51% (see image below).
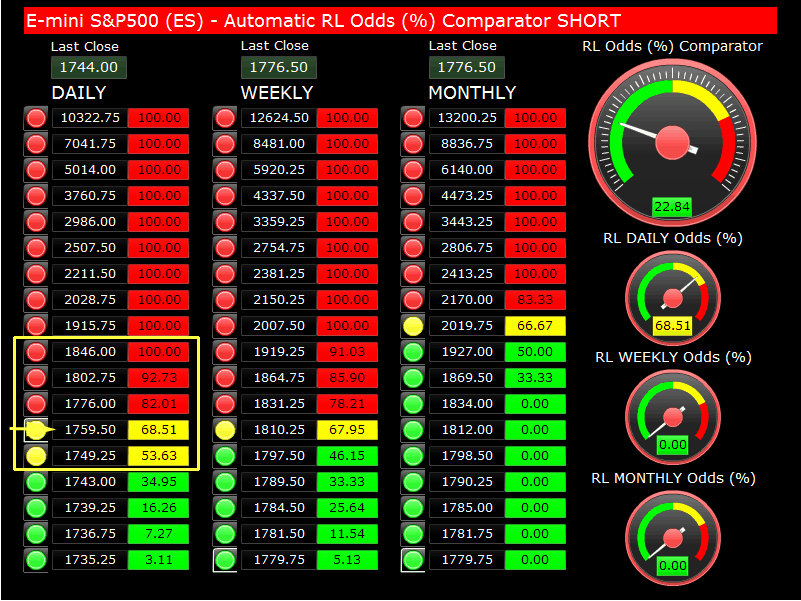
The 1749 level has decent odds, 53.63%. In any case, between 1749 and 1759 (better) is where we would place our SHORT bets (and place a Stop Loss as usual, in case the trade does not work).
This trade leverage the odds readings from our tools to try to pinpoint the next turning point, in case there is a continuation of the downtrend seen so far.
However, we have to add two things:
1) you can see from the screenshot above all the other SHORT odds, Weekly and Monthly, are 0% at the1749-1759 area (there are no levels to go SHORT there, Weekly and Monthly).
2) as anticipated at the beginning of this week, the LONG odds are growing, on Daily, Weekly and Monthly time periods. If you have access to our online calculators you can see that by yourself from the D+W+M Odds Comparator.
In conclusion what we are trying to say is that we think the downtrend is almost over, even if the market performs one more dive from here, it will reach levels with such good odds to go LONG that we will see a bounce, at least lasting one week (possibly more).
If you want to sign up to our the online quantitative tools shown in this post, please follow this link and subscribe to the special “SOH Offers”.
Copyright © 2014 Retracement Levels. All Rights Reserved
Comments
No comments yet.

