Source: ritholtz
Below are all items from ritholtz.

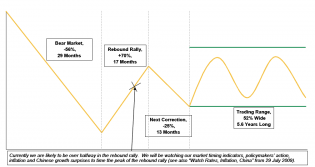
china-market.png (1334×1182)
China’s Market and Policy Timeline
3

deaths.png (3088×2018)
Global Death from Conflicts - - fascinating historical perspective
1
4
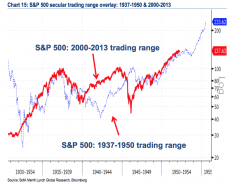
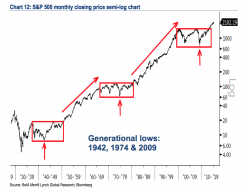
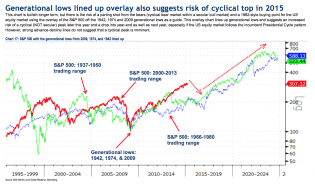
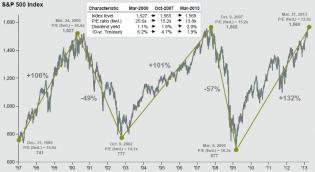
From http://www.ritholtz.com/blog/2015/04/generational-lows-lined-up-overlay-also-suggests-risk-of-cyclical-top-in-2015/

1
3
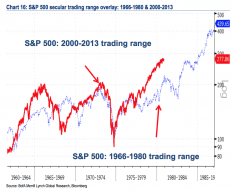
From http://www.ritholtz.com/blog/2015/04/generational-lows-lined-up-overlay-also-suggests-risk-of-cyclical-top-in-2015/
2
From http://www.ritholtz.com/blog/2015/04/generational-lows-lined-up-overlay-also-suggests-risk-of-cyclical-top-in-2015/
1
From http://www.ritholtz.com/blog/2015/04/generational-lows-lined-up-overlay-also-suggests-risk-of-cyclical-top-in-2015/

Income.jpg (630×909)
The rich get richer - it's the law of the land.
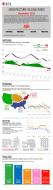
Architecture Billing Index | The Big Picture

10 Laws of Stock Market Bubbles
Kass: 10 Laws of Stock Market Bubbles | The Big Picture
10 Laws of Stock Market Bubbles
2
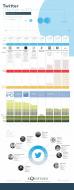
twitter_infograph_final4_superhires.jpg (631×1600)
Twitter's path to its IPO

SPX-QE.png (960×720)
Amazing chart of how much QE has artificially propped up stock prices.

Screen-Shot-2013-10-17-at-10-17-4.01.35-PM-383x620@2x.png (766×1240)
Smartsphones

SPX-cycles.png (1031×569)
Equity inflection points
1

100508_moneycrisis466_308.gif (466×308)
Graphic Depiction of Finance Crisis

bull-market-corrections.png (1100×610)
Bull Market Corrections, 2009-2013
2008 to 2013: The Financial Crisis in 9 Charts
2008 to 2013: The Financial Crisis in 9 Charts | The Big Picture
2008 to 2013: The Financial Crisis in 9 Charts
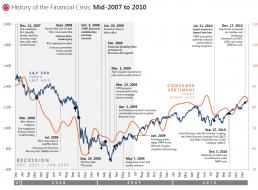
page-5.jpg (1186×872)
History of the Financial Crisis: Mid-2007 to 2010

us.jpg (1200×682)
Map Shows How Americans Really Feel About Each Other
3
syria

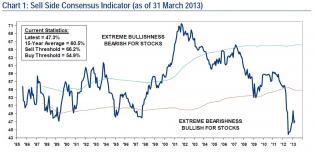
investor.jpg (1076×606)
AAII Asset Allocation Survey (Equities) – Deviation from mean
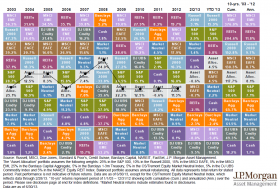
Table
What a pretty chart, so colorful. It may explain why I tend to lose in this market: I'm a "winter" and my colors...
Everybody loves a good storyBarry RitholtzWashington Post, July 26 2013When it comes to storytelling, we have a long and venerable history of narrative. The spoken word emerged millennia ago — before even the Greeks — when the onl...
Curse of the Narrative: Everybody Loves A Good Story | The Big Picture


Logo
An interesting article in the Atlantic contends that fast food isn't necessarily more evil than the "healthy" alte...
3
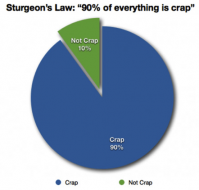
sturgeons-law
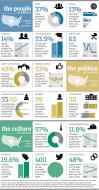
Who's part of the 90%?
Chart
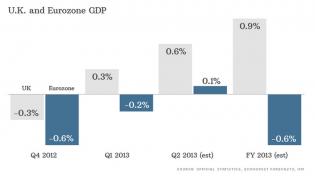
England swings like a pendulum do...
Chart
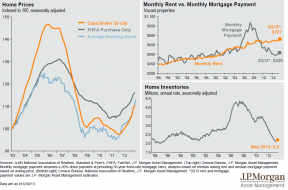
Fundamentals on housing looking stronger, though mortgage rates can't keep going up without doing damage.
Graphic
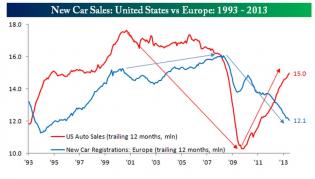
US car sales up, European car sales down: maybe they all take the bullet train now.
2
Chart
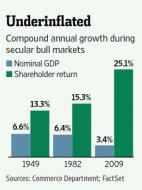
Because this recovery is just so special.
2
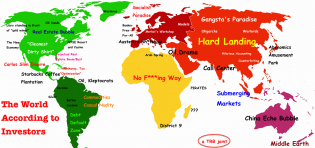
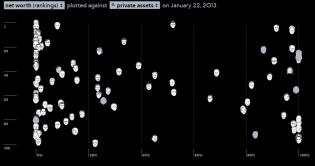
world-investors.png (1247×589)

2
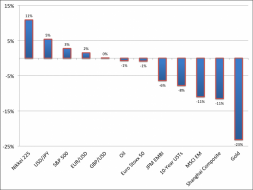
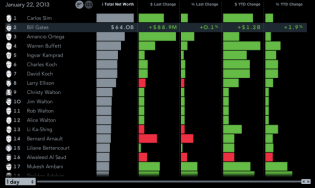
scoreboard
Sell Japan, buy gold?
1

Map
Not an accurate assignment of names, but the point is not to be missed: this is fascism.
1
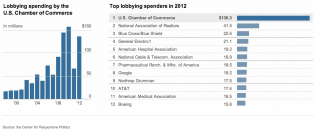
Graphic
The Chamber of Commerce is not working for mom and pop stores anymore; they have deep, deep pockets.
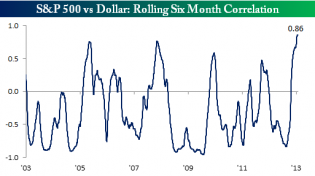
Correlation1
Dollar vs S&P hits extreme
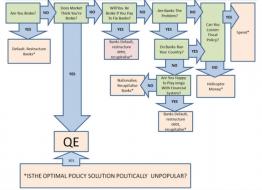
Chart
QE Because nobody's got any better ideas.
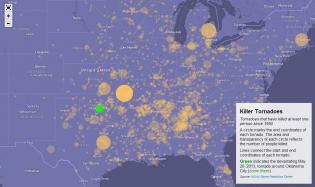
Graphic
map of killer tornadoes
1
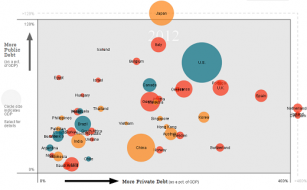
The Big Picture
And here we see them now. See how Japan has left the zone? The Netherlands is outside the box, too.
3
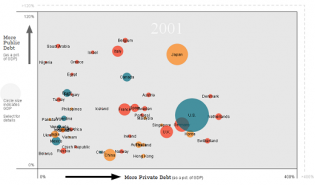
The Big Picture
Here we see the bubbles 12 years ago
BLB37fcCUAA6v_l.png 1,011×581 pixels
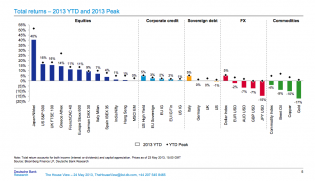
The winners and losers
1
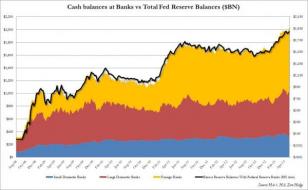
Fed Pours Huge Sums Into Foreign Bank Coffers | The Big Picture
And the foreign banks are the ones buying up stocks, making all the magic happen? I suspect it is all the banks f...
1
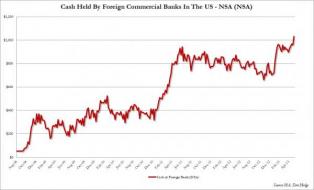
Fed Pours Huge Sums Into Foreign Bank Coffers | The Big Picture
So the Fed gives our tax dollars to foreign banks to bail them out? And this is their clever plan to keep inflati...
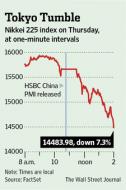
Tokyo Tumble
Chart
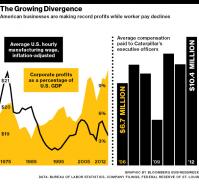
As I see it, workers' wages are going into corporate pockets.
1
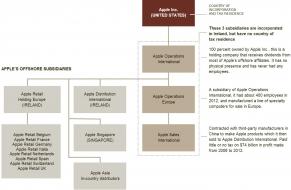
apples-offshore.jpg (1418×924)
Apple's tax-cheating ways in action
4
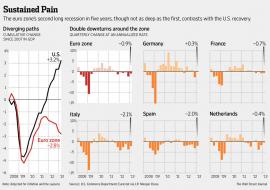
WO-AN786_Euecon_G_20130515190023
Europe dips while America zips? Is this the big disconnect?
1
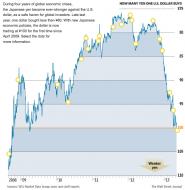
Yen timeline
Sorry if this is a repeat of another. It seems important to me. Lots of charts too.
Living In A QE World | The Big Picture
Sorry if this is a repeat of another. It seems important to me. Lots of charts too.

2

apr-employment-overview.png (1024×1195)
The labor market

yens.jpg (970×1062)
Abenomics Illustrated

char-tof-the-week.jpg (897×590)
Bank Stocks Face Technical Resistance
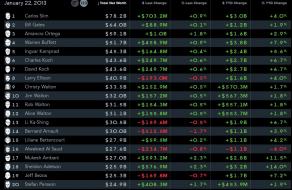
Property & Wealth Through the Eyes of Mega Millionaires
Lifestyles of the rich and richer.
1
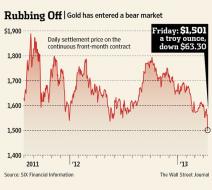
BF-AE754_CMDGOL_G_20130412215103
Crap! Do all of my investment strategies have to end up as roadkill?

labor-slack.png (849×515)
Labor Slack Points to Structural Employment Problem

pirates vs bankers
Arrrgh!
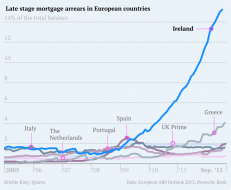
late-stage-arrears-in-europe2
Ireland struggles on; how is the rest of the world doing so very well?
SP.jpg 958×524 pixels
From "The Big Picture"
1
Chart
Never giving up hope, we still look for a way out of this bullish nightmare. Still have to make it through April,...
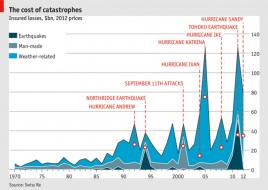
Chart
Calamities are in a bull market!
1
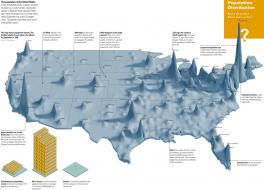
population-distribution.jpg (1283×922)
Population Distribution of USA

CHART-1.jpg (1138×379)
Change in Government Consumption and Investment
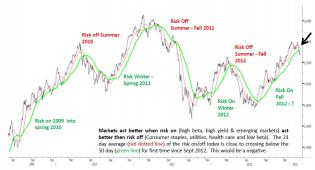
risks.jpg (943×510)
Risk On, Risk Off Index

020113-airlines-v3b.png (956×787)
How the USA Ended up with only 4 Airlines
1
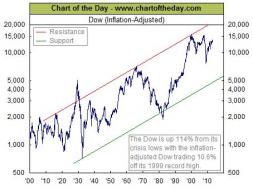
chart-of-the-day-feb.jpg 454×340 pixels
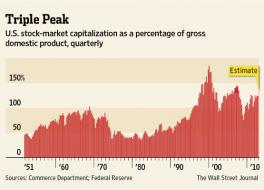
triple-peak.jpg 555×398 pixels

shade-80s.jpg (983×813)

assets-in-all-us-exchange.jpg (959×731)
The Ongoing Rise of ETF Assets

stock-market-cap.jpg (963×724)
Market Capitalization As A Percentage Of GDP

plastic-surgery.jpg (595×708)
Plastic surgery around the world
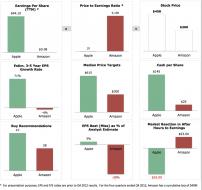
eps-per.jpg (919×861)
Comparing Apple vs. Amazon Valuations

20-years.jpg (1105×643)
Job Growth, Productivity and Labor Force

case-shiller.jpg (1262×755)
Case-Shiller: Home Prices Rose November 2012

wir_overbought4.jpg (900×578)
US markets are looking awfully overbought here.
apple-earnings-charts-1q13
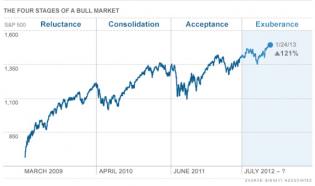
4-stages-of-a-bull-market.jpg (689×407)

ETFs-over-active.png (701×394)
Investors Continue to Pick ETFs over Active Funds
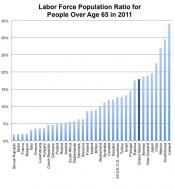
economix-24oecdlfpr65plus-blog480
Chart
Chart
Billionaires-ranked
Billionaires!
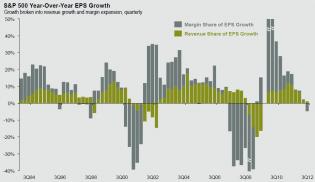
EPS-Growth.jpg (1057×614)
S&P 500 Year-Over-Year EPS Growth
20130123
This does not look like a bear's favorite chart.

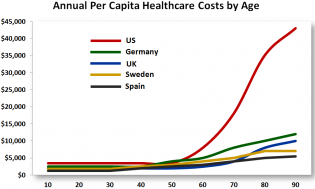
pharma.jpg (904×648)
Pharmaceutical Spending Per Capita

20130126_woc818.png (595×857)
The economic performance of American presidents tends to deteriorate during their second term:

LARGE-cap-stocks.jpg (997×656)
Volatility Relative to Large Cap Stocks
speech.jpg 677×1,292 pixels
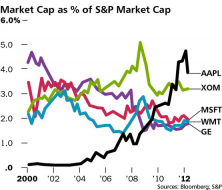
market-cap-percent-spx1.png (555×474)
5 Biggest Market Caps As % of S&P500
1
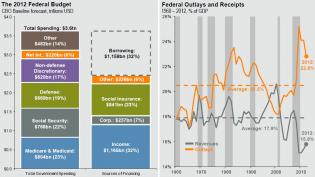
federal-budget.jpg (1094×616)
The 2012 Federal Budget

bull-duration.png (507×446)
Bull Market Durations

negative-and-near.jpg (928×574)
Near Negative Equity Still A Policy Challenge

seven-resolutions1.jpg (555×2181)
WSJ: Get Your Nest Egg in Shape

FirearmFacts.png (600×831)
Gun Rhetoric vs. Gun Facts
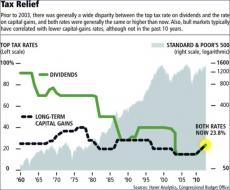
tax-relief.jpg (742×611)
How the fiscal cliff deal affects investors

chart-3-barry.jpg (1472×595)
And for South America including, Brazil, Argentina, Chile and Peru who experienced massive inflation in the 1960...

chart-2-barry.jpg (1472×595)
GERMANY to 1820 in a separate chart because of that WEIMAR REPUBLIC hyper inflation.

chart-1-barry.jpg (1472×595)
Here is a look at long term Inflation we spoke about earlier on the US, FRANCE, JAPAN, UK and SPAIN to 1868

dow-jobnes.jpg (1032×609)
Dow Jones Industrial Index, Price Return (Since 1900)
secular-bear-markets.png 1,008×537 pixels
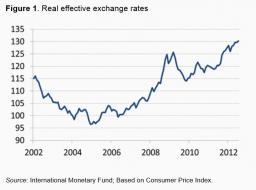
exchange-rates.jpg 673×498 pixels

The Internet A Decade Later | The Big Picture
The Internet A Decade Later
http://theincidentaleconomist.com/wordpress/wp-content/uploads/2012...
1