Browse Stacks: Patterns: Inverse H&S
slopechart_CVNA.jpg
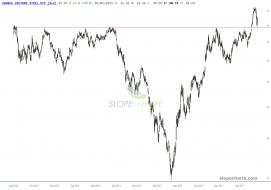
IHS within an IHS
slopechart_CVNA.jpg
perfect inverse H & S
must be a short squeeze or something
slopechart_ORLY.jpg
4
GBPEUR.jpg
$GBPEUR IH&S on the 1d chart. If you look at the 1h chart you'll see bull flags in quick succession. This is likel...

1
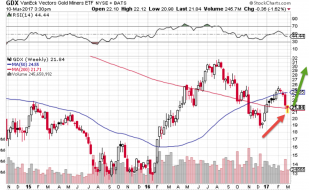
slopechart_GDX.jpg
possible IH&S forming

slopechart_EQT.jpg
could be a right shoulder forming on an IH&S
these energy stocks look bullish for the most part to me
slopechart_EOG.jpg
bullish breakout
100 seems a foregone conclusion
ISVLF.jpg
Perfect entry for what looks like a very likely IH&S on Impact Silver (symbol ISVLF and IPT.V for Canadians).
3
slopechart_MUR.jpg
A triangle inside of a wedge. 16 is the neckline of an IH&S inside the triangle also, if you look hard enough. 25...
slopechart_AAP.jpg
Everything is set up for a move higher.
1
slopechart_MA.jpg
Looks like a little inverse head and shoulder action.
slopechart_CBOE.jpg
Inverse H&S in the making?
slopechart_PFE.jpg
3 year IH&S
1
slopechart_ZI.jpg
Beautiful IHS
slopechart_NBEV.jpg
IH&S looking base.
1
vix-10.png (768×338)
slopechart_STX.jpg
IHS look about it
slopechart_ROKU.jpg
slopechart_IFF.jpg
Now that would be a big IHS if it completed.
slopechart_WFC.jpg
Possible IHS forming. Low risk long with stop at 24.75
slopechart_NEPT.jpg
IHS measured move to over 5 if it completes
1
slopechart_IWO/IWN.jpg
Growth vs. Value ETFs. I see a slow grind higher for growth stocks relative to value stocks until the end of Octo...
3
slopechart_ABM.jpg
IH&S measured move around 41
slopechart_BRK.B.jpg
Grandpa Munster is probably toast. Apologies to Bill Maher and Senator John McCain.
3
slopechart_CDXC.jpg

INXG.jpg
Daily chart of $INXG. Bailed out of $INXG at the red arrow (red candlestick on lower high). Re-entered at the gree...
1
nyse-working-on-neckline-breakout-dec-16.jpg (1892×907)
1
s3.amazonaws.com/cdn2.soci..._1CPqul_l.png
RTY support and resistance levels
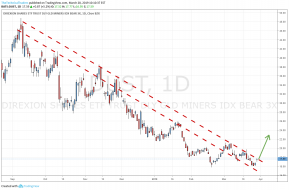
NUGT.png
http://www.321gold.com/editorials/sfs/hubbartt092019.html
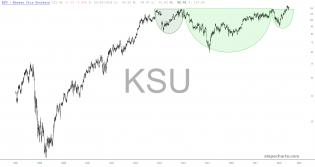
slopechart_KSU.jpg
Probably the best looking component in the Transports

slopechart_BCS.jpg
$BCS Barclays looks like it's setting itself up for some upside action.
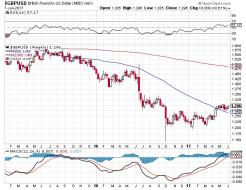
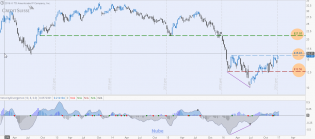
GBPUSD.jpg
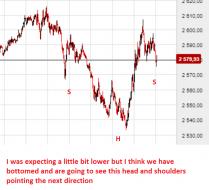
Nailed the last IH&S.
2

GBPUSD.jpg
IH&S on Cable ($GBPUSD)
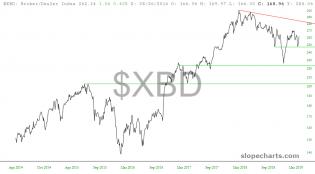
slopechart_$XBD.jpg
IHS forming. It's like a funnel cloud, maybe it will turn into a tornado, maybe not. Crooked neckline could cause...
chart


weekly.jpg
Here's a UK smaller companies fund. Looks it will go higher no matter what the final result of Brexit is. And yes,...
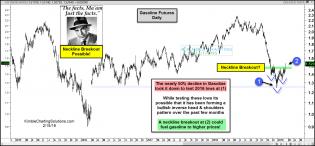
joe-friday-gasoline-attempting-neckline-breakout-feb-15-1.jpg (1...

VIX-inverse.png (1409×690)

dechra.png
Here's an interesting one in London called Dechra Pharmaceuticals. The British equivalent of $RUT has taken a beat...
1
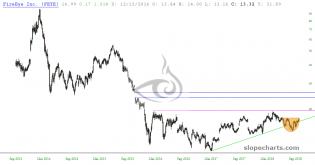
slopechart_FEYE.jpg
Scraggly looking IHS will be looking to get long at 17, target 19, stop 16.
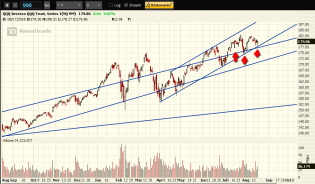
s3.amazonaws.com/cdn2.soci..._FdH6Ws_l.png
$QQQ and NQ double hammer on support. Possible IHS.
slopechart_FWONK.jpg
Potential IH&S on Liberty Media $FWONK
2 aug9.PNG

s3.amazonaws.com/cdn2.soci..._QJFh7x_l.png
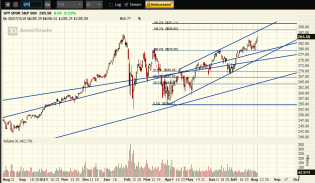
$SPY Double Bottom / Sloppy IHS targets $305.
9 aug1.PNG
1
1 may30.PNG
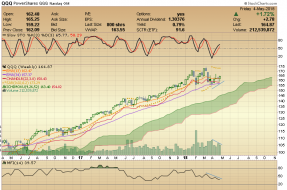
QQQ.png
2
8 may3.PNG
6 may1.PNG
1 apr30.PNG
2
2 apr20.PNG

1 apr20.PNG
7 apr18.PNG
1 apr9.PNG
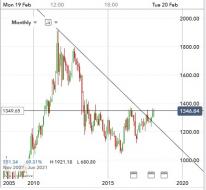
gold.jpg
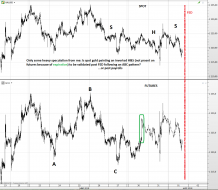
IH&S on the monthly physical gold chart.
1
slopechart_SLX.jpg
SLX bounced off support. Will it hold?

3 feb9.jpg

TNX.png
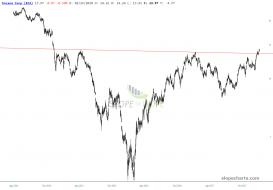
$TNX 10 year U.S. treasury yield has a clear IH&S. Graph borrowed from http://www.marketoracle.co.uk/Article61385.html
slopechart_ECA (1).jpg
inverse H&S on Encana (ECA)
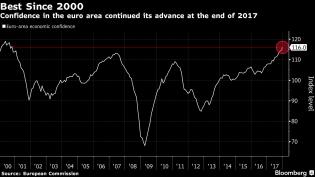
eec.jpg
European economic confidence.
4 nov7.PNG

2 nov1.PNG
gilts.jpg
UK gilts finally moving back up. Most economists would claim that this is because the Bank of England just said th...
soup.jpg
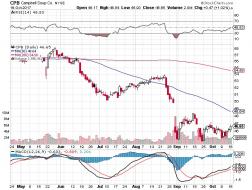
IH&S or bear flag on Campbell's Soup? Weekly IH&S not as convincing as daily.
2

UK Gilts.jpg
UK gilts has an inverse H&S and bullish crossover on MACD. It last did this 3 months ago. Not the most volatile in...
slopechart_EPU.jpg
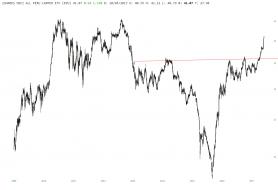
Peru (EPU) breakout.
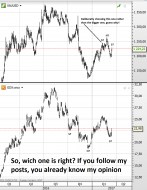
5 sept25.PNG
Don't pick the wrong one ;)
USDJPY.jpg
IH&S on USDJPY. The dark shaded areas are two channels that the price has been following.
4

oil.jpg
What do you think @Pipesticks? Does that look like an inverse H&S to you?
4
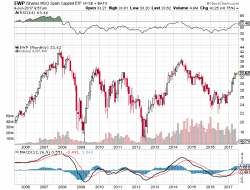
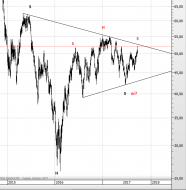
20170609ewp.png
Potential inverse H&S on Spanish ETF (as well as the national IBEX index)
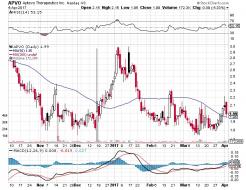
APVO.jpg
I think it is worth paying attention to $APVO after its pullback today touched the 50dma and forming part of a per...
5 mar16.PNG
2017-03-10_15-30-44.png

3

$UKT10Y.jpg
10 year UK treasury yield inverse H&S
1
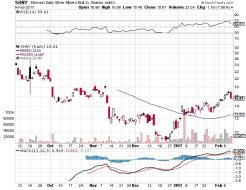
SHNY.jpg
Inverse H&S on a 2x silver miners ETF called $SHNY . The current direction on this one today is down. This is a da...
20170208bap.png
This is 22% of EPU. EPU has the same inverted H&S pattern, similar target, but this stock BAP has already broken o...
20170208epu.png
Massive inverted H&S on Peru EPU
1
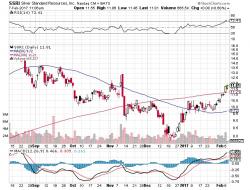
SSRI.jpg
Inverse H&S for silver miner Silver Standard Resources $SSRI
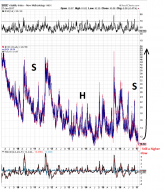
5 jan29.PNG
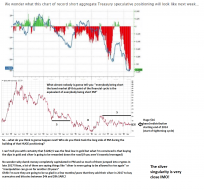
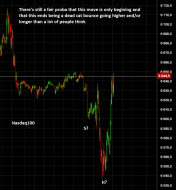
That was extremely close but H&S pattern is still intact
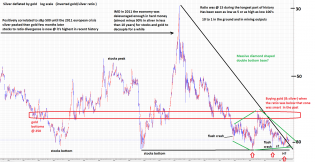
So IMO volatility has bottomed and will diverge from pri...
1
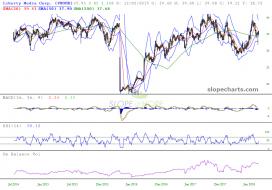
CS.png
CS is still crazy attractive to me here.

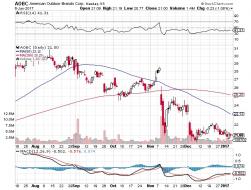
AOBC.jpg
They changed 'Smith & Wesson' to 'American Outdoor Brands Corp.'. Can you believe that?
Screen Shot 01-08-17 at 07.53 AM 001.PNG
Credit Suisse has a nice weekly setup here for me.
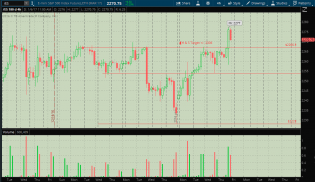
2017-01-06__ES.png
IHS on /ES 4 hour chart. Target is 2306 +/-.
1
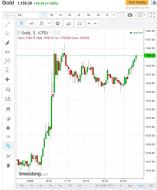
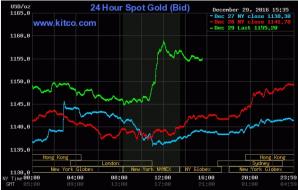
gold.jpg
Update on the daily spot gold chart. Perfect flag. Mostly green climb.
4
gold.jpg
3
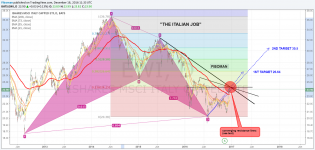
EWI 18.12.16.png
The Italian Job

1

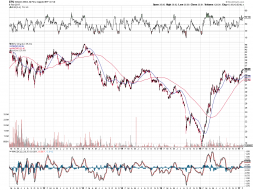
oil-sector-working-on-neckling-breakouts-dec-12.jpg (1568×704)
Energy sector breakout
1
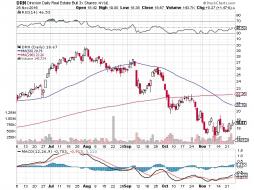
DRN.jpg
Alternative suggestion to $IYR which has a very similar chart is $DRN. It's a 3x real estate ETF that will payout...
5
BDI.jpg
Baltic Dry Index inverse H&S and momentum.
2

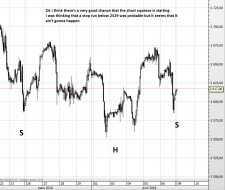
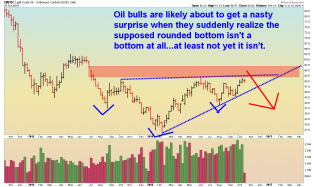
Oil - Weekly - 11.2.16.png
Oil - weekly chart. This is not investment advice.

5
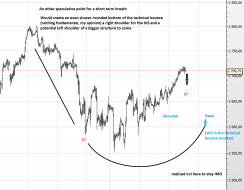
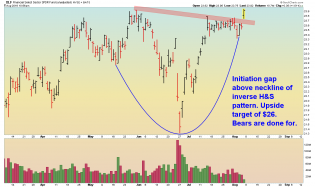
Oil - Daily - 10.19.16.png
Oil - daily chart. This is not investment advice.
7

glpg.png
Galapagos NV on the Nasdaq looks ready to pop with inverse H&S pattern on weekly chart.
1
12 sept9.PNG
Clearly not impossible to go to a new 52wk low
P/E20 (blue line) has been a very strong RESISTANCE through hist...
4

China - Daily - 8.25.16.png
China - daily chart. This is not investment advice.
6

XLF - Daily - 8.17.16.png
XLF - daily chart. This is not investment advice.
1

crude-nyse-both-creating-bullish-inverse-head-and-shoulders-pattern...
Inverted H&S forming in crude oil?
1
XLF - Daily - 8.5.16.png
XLF - daily. Bears had their chance and they blew it. This is not investment advice.
13
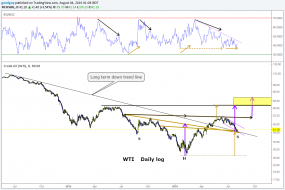
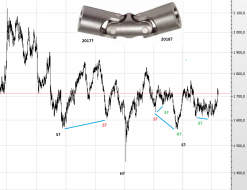
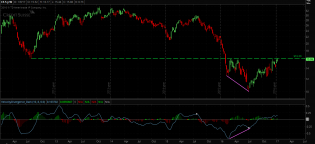
wti daily log.png
USOIL: looks like a good set up for "kiss and run" (up). Strong up day right at the longer term down trend line.

4
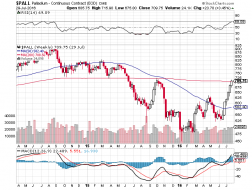
pall.png
Today Physical Palladium is showing off on the weekly chart and gently prodding through the 200 week moving average.
3
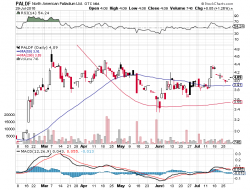
paldf2.png
Another PALDF chart showing last contact with 200 dma.