Date: March 28, 2014

VXX DAILY.png
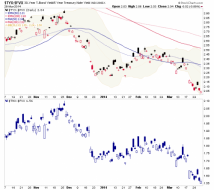
$VXX: The pattern is getting compressed suggesting that a breakout is imminent

tyx.fvx
Yield spreads have not turned Gold Bug Friendly yet... 30-5 and 10-5 at new lows.

1

SPX 5 MIN.png
$SPX: Corrective bounces are sold. It should be the bearish wave (C

marketzone - $AAPL bearish harmonic pattern near target 1 - 533$...
AAPL bearish harmonic pattern reaching target 1

Biggest Baddest Bubble Blown Bursts
Biggest Baddest Bubble Blown Bursts…….Evil Plan 0.00 (By BDI...
Biggest Baddest Bubble Blown Bursts

1
Well, my fellow Slope-a-Dopes, as you know, I’m not even supposed to be here. Alas, the ominous geopolitical developments unfolding before our very eyes have the idiot insanely infatuated. The Savant must once again sound off, as he...
Globalists Gas Game Theory…….EP End-Game by BDI | Slope of Hope
1
Good afternoon my fellow Slope-a-Dopes. ? I’m sure you’re asking yourselves what the hell is he doing back here after having made such a fuss about his taking a leave of absence due to serious health concerns. ? Well, I’m currently...
President Putin Pisses on POTUS………Last Evil Plan by BDI? | Sl...
Well, Slope-a-Dopes, it is with a very heavy heart (no pun intended)? that I am compelled to announce my departure. ? I’m afraid I have concluded that it will be for the best that I make a graceful exit at this time. ? As most of yo...
The Likeness of God is to Create……The Eternal EP by BDI | Slope...
1
Good afternoon Denver Dopes, just though I’d entertain you with a quick BDI Shuffle before the main event, the Sherman Super Bowl Shuffle, begins in earnest. ? The suspect super strategy that I will attempt to tackle today should ta...
Spiked Super Bowl Shuffle BDI Style…….EP XLVII | Slope of Hope
Well, my fellow Slope-a-Dopes, I just could not bear sitting in silence any longer while all the blabbering bulls boast and gloat as they roast bear chestnuts over an open fire. ? Enjoy your happy holidays highs, my bloated bovine but...
Cowgirls Wearing Pink Shades……Evil Plan 1001 (by BDI) | Slope of Hope
1
shapeimage_22.png (598×332)

Bj0qC1vCYAAMkRZ.png:large (1022×557)
Risk has been punished in March, chart via @andrewunknown shows a clear preference for safe “Old Economy” stocks

YCS DAILY.png
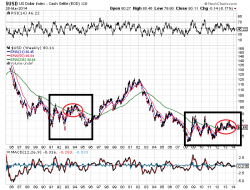
$YCS: Daily chart with few thoughts

SPX 5 MIN.png
$SPX: It is a Zig Zag up but a stronger move will jeopardize the wave C option

EUR 120 MIN.png
$EURUSD: Follow up of the panned out wedge
sc (13).png
USD Long Term- A Bottom Pattern?
http://goldenopportunitytrading.blogspot.co.uk/2014/03/usd-long-term-bottom-patte...

3
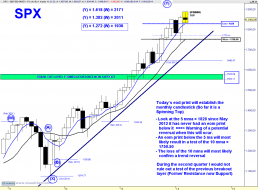
SPX MONTHLY.png
$SPX: Monthly chart with few thoughts

FDAX 60 MIN.png
$FDAX_F : It feels like a thrust following a Triangle. A top is approaching