User: Brian Ripley: U.S. Economy
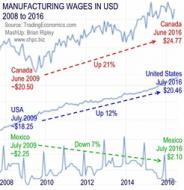
Manufacturing wages in Canada, USA & Mexico
Manufacturing wages measured in USD since the gloom of 2009 in Canada, the U.S. and Mexico. More at www.chpc.biz

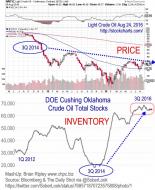
Oil Stock Inventory
Videos included: Grim expense report: Alberta's debt soars to $10.9 billion AND The Grand Opening of the Tesla Gig...
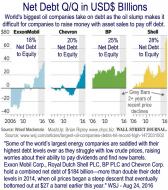
Big Oil Net Debt to Equity
"Some of the world’s largest energy companies are saddled with their highest debt levels ever as they struggle w...
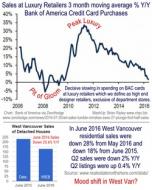
Luxury Spending
Chronically low interest rates since the Pit of Gloom in March 2009 have fueled a huge credit bubble in Canada. St...
1
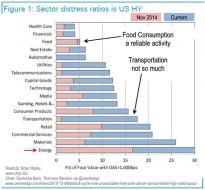
High Yield Distress
In other words, what was until a year ago a purely "energy" phenomenon is now an "everything" phenomenon, despi...
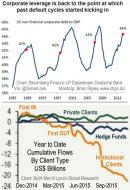
Credit Default Cycles
The top panel shows U.S. non-financial corporate debt to GDP at levels where credit defaults start hitting the fro...
3
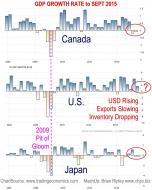
GDP Growth Rate of Canada, U.S. & Japan
The chart shows the GDP growth rate in Canada, the U.S. and Japan since before the 2009 Pit of Gloom to 3Q 2015...
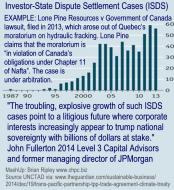
ISDS Growth since 1987
Who will benefit from the Trans-Pacific Partnership?
"The troubling, explosive growth of such cases point to a li...
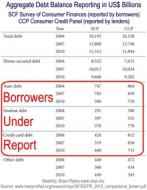
U.S. Debt Surveys 2004-2010
Do We Know What We Owe? Consumer Debt as Reported by Borrowers and Lenders. Mashup of U.S. Home Ownership chart an...
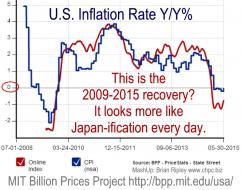
MIT Inflation Rate
Here are a few charts tracking inflation data. Since the 1980's inflation highs in Canada, the U.S., Germany and J...
1
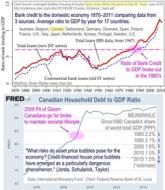
Ratio of Bank Credit to GDP since 1870
"The negative feedback loop of falling stocks in a world of extremely tepid global demand might just make the craz...
1
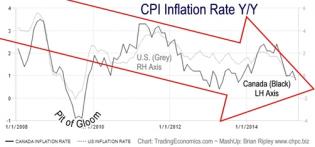
CPI Inflation US+Canada 2008-2015
The USD/CAD ratio has turned up this past week. A strong U.S. Dollar will mute U.S. inflation since domiciled U.S....
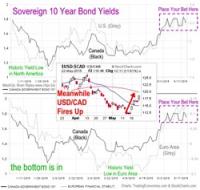
10 Yr Bonds & USD May 2015
"Liquidity is the most under appreciated risk factor out there. We've seen the bond market reprice to an understandin...
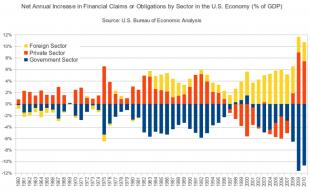
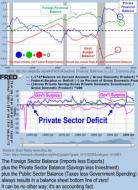
U.S. sectoral financial flows add up to zero.
Balanced Budget Bluster
Joe Oliver presented the delayed Canadian Government's budget yesterday and touted it as...
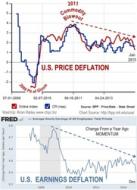
Price & Earnings Deflation 2008-2014
The charts above show the ongoing DEFLATION in consumption prices and wage earnings. The top panel is the MIT Bill...
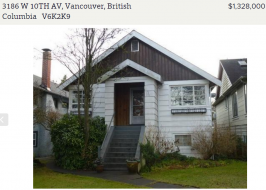
Cheapest building lot on the west side of Vancouver Dec 2014
For some reason the Slope app will not pick up the first image on this post of the 3 panel chart showing lending t...
1
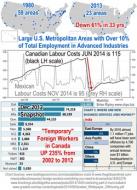
Temporary Foreign Workers & Offshoring
Businesses are running out of (good) jobs to outsource, but we can still outsource the crappy ones eh!
By 2016...
1
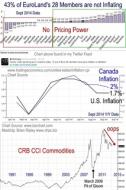
EuroLand Deflation Sept 2014 Data
I noticed on my Twitter feed a chart on the Eurozone members' inflation rates and lack thereof. Almost half the me...

Percent of total bank lending 1928-2007
U.S. mortgage loans in banks’ total lending portfolios have doubled from about 30% in 1900 to about 60% today....
Picture
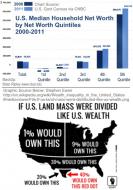
In the U.S. those in the lowest 20% quintile had a negative median net worth of -$6,029 in 2011, compared with -$9...
1
Picture
What could disrupt the boom? The disrupters are innovation (Elon Musk etal), a rising supply of energy (U.S. fracking...
Picture
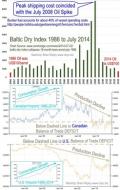
The main driver of the 2005-09 surge in the BDI was linked to commodity prices, particularly oil. The index then p...
Picture
“We will increase the fluidity of information and ideas by taking actions to flatten the organization and develo...

Picture
Demand is Local, Supply is Global. As the USD strengthens, the U.S. consumer inflation rate continues to drift dow...

Picture
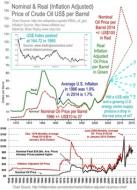
Oil Can Economics
Canadian Oil Production UP 12% Y/Y at Dec 2013 - 3,822,000 Barrels per day
U.S. Production (2...
Picture
Canada's Minister of Finance suddenly resigned earlier this week. The government's major fiscal policy plank is to...
Picture
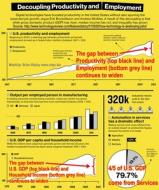
"GDP growth continues to be low in the U.S. and real total household wealth has stagnated and real median househol...
Picture
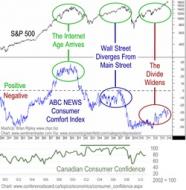
The Class Divide - Consumer confidence depends on where you live, what you are employed at, the availability of go...
Picture
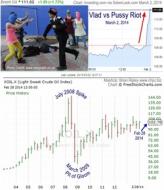
Lookout Suburbia - I noticed a tweet today from SoberLook.com Two myths about the Ukrainian conflict reminding us...
1
Picture
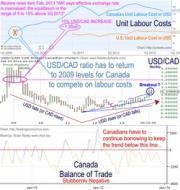
The chart mashup shows the difference in labour unit cost between Canada and the U.S. in the top panel and the ste...

Picture
Anyone with a Twitter feed knows that a lot of correlations are being made this year with the weather. The bottom...
1

Picture
The sample price drop building reminded me of New York where the term "jonesing" is said to have originated and th...
4
Picture
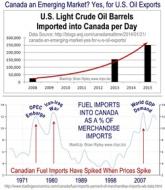
The Wall Street Journal: "Canada an Emerging Market? Yes, for U.S. Oil Exports". Light crude imported into Canada...
Picture
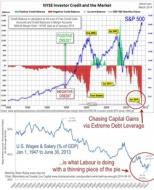
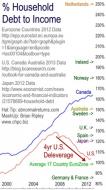
The problem is not that prices drop but that the debt used to chase the prices up does not decline with the price....

Picture
Lance Roberts makes the cogent observation that what really drives long term economic growth is not residential in...
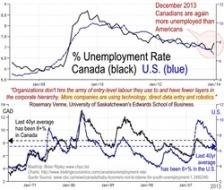
Picture
"Organizations don't hire the army of entry-level labour they use to and have fewer layers in the corporate hierarchy...
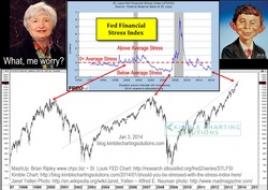
Picture
What, me worry? Messieurs Poloz, Flaherty, Carney, Bernanke and Madame Yellen et al are all on the record warning...
1
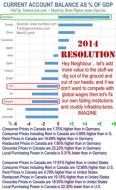
Picture
IMAGINE... ...if we stopped competing with low wage producers and turned our attention to our own failing institution...
1

Picture
Look at a long term chart of the comparison between Canadian and U.S. Treasury 10 year yields and they move in the...
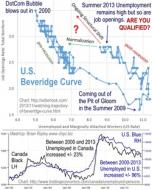
Beveridge Curve 2000-2013
This chart mashup shows the Beveridge Curve which is the inverse relationship between the unemployment rate and th...
2
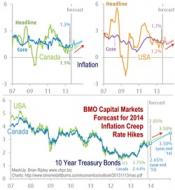
BMO Rate Forecast
BMO Capital Markets Economic Research released their North American Outlook (Nov 13, 2013) which included a foreca...

Good Time to Rent
Timing is Everything. Now that we are on the seasonal down ramp into the 2014 spring bottom for sales and listings...
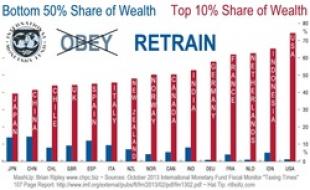
Share of Wealth
"We're in California, isn't there a better way of doing that?" Elon Musk. The bottom 50% of most national populations...
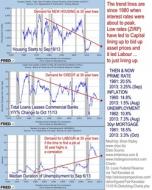
US Housing, Credit & Employment
The North American "Spring" seems nowhere in sight, so forget the revolution. Perhaps the reset will be a "restructur...