Users: Violet: slopechart_GE.jpg
slopechart_GE.jpg
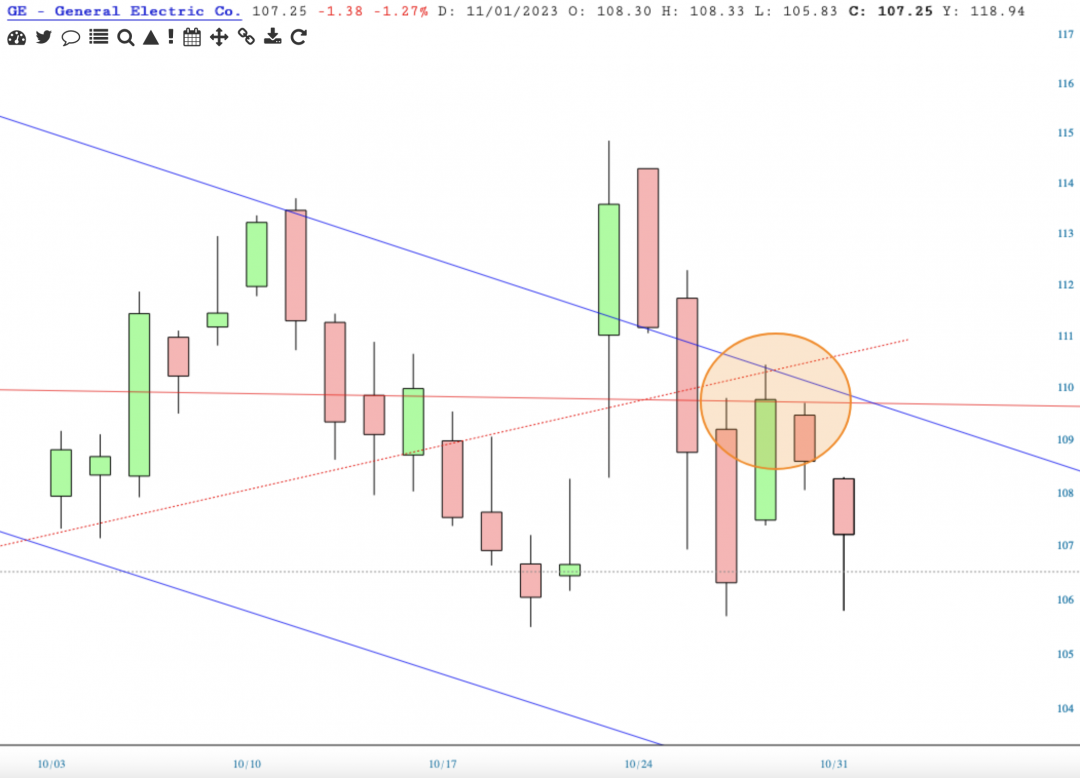
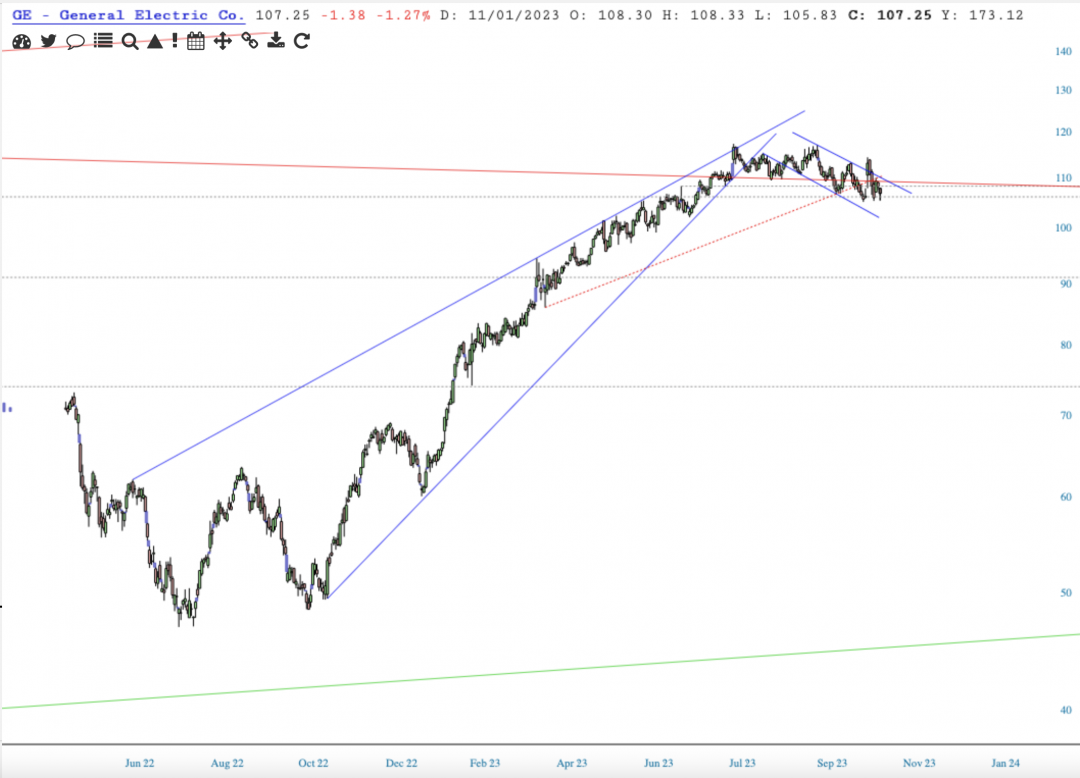
Beaut of a top on GE.
Comments
 Violet
Note the three circled candlesticks.
 11/1/23
How much compensation does a wedge this size deserve?


Bulkowski:
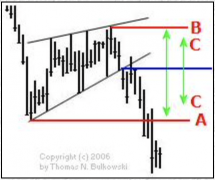
For downward breakouts, the lowest valley in the pattern (A) is the price target.
Alternatively, compute the height from the highest peak (B) to the lowest valley (A) and then multiply it by the above 'percentage meeting price target.' Add it to (upward breakouts) or subtract it from (downward breakouts) the breakout price (the point at which price crosses the trendline, shown in the Measure Rule figure to the right as a blue line for this downward breakout) to get a price target (C).
Bulkowski also says: "Rising wedges, especially for downward breakouts, are some of the worst performing chart patterns. Downward breakouts have unacceptably high failure rates and small post breakout declines."


