View: IWM daily and 1 hour log.png
IWM daily and 1 hour log.png
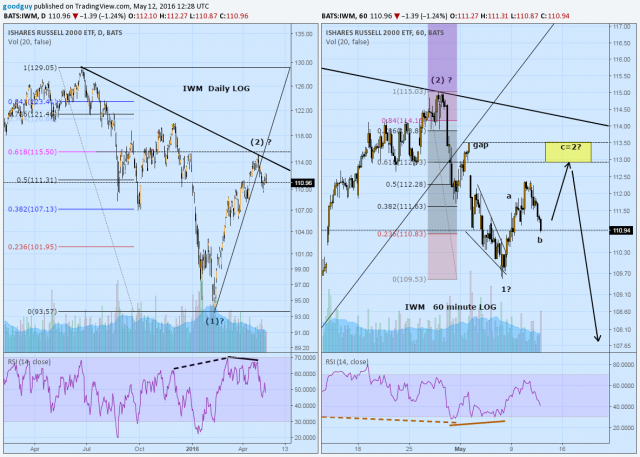
Notice the major up move from around 2/10 was almost a .62 correction (on daily chart). I favor the most recent up move the last few days (see hourly chart) is also most likely an a-b-c correction as part of the larger topping pattern. A likely target is a .62 correction or a little higher to close the gap. If we then get a trend line break up the current move or bearish candle formation on the daily I think it would be a great potential point to short. (2x bear ETF is TWM, 3x bear is TZA).
Notice on the daily RSI we had a negative reversal and a bearish divergence at the top labeled (2). Also on the hourly we had a positive reversal and bullish divergence on the hourly RSI at the bottom labeled 1.
Take care. Tomb
 007Dad

