Source: kimblechartingsolutions
Below are all items from kimblechartingsolutions.

gold-silver-ratio-could-be-creating-head-shoulders-top-july-31.j...
Below looks at the Gold Futures/Silver Futures ratio over the past decade. The ratio bottomed in 2011 and started...
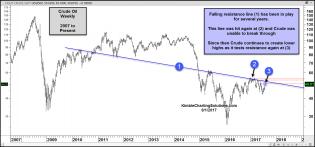
crude-oil-falling-resistance-test-aug-1.jpg (1570×735)
Crude Oil is worth about a third (down 65%) of what it was worth back in 2008. It’s lost about half of it value...

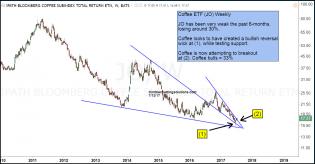
coffee-another-bullish-wick-after-breakout-july-28.jpg (1294×678)
Could these large decline present an opportunity in Coffee? Sure could! Below looks at the chart of JO and what th...
2
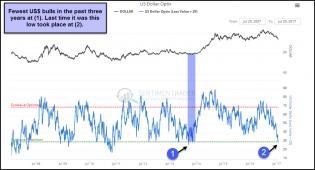
us-dollar-bulls-lowest-in-three-years-july-26.jpg (1143×619)
Mega-low sentiment on the US dollar
1
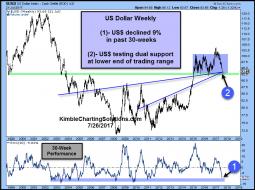
us-dollar-9-decline-in-30-weeks-testing-dual-support-july-26.jpg...
Below looks at the US$ over the past 18-years, with 30-week performance applied-
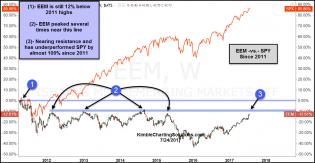
eem-vs-spy-since-2011-highs-july-24.jpg (1297×673)
Below compares the performance of EEM to the S&P 500 since 2011
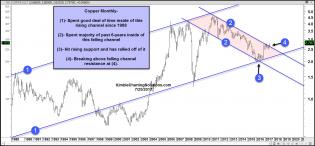
copper-monthly-breaking-out-july-25.jpg (1573×732)
Below looks at Copper Futures on a monthly basis, since the late 1980’s. A good deal of the past 30-years, Doc C...
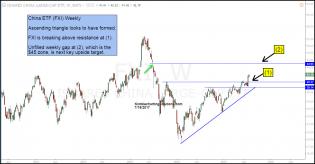
fxi-ascending-triangle-breakout-next-target-unfilled-gap-july-19...
China ETF (FXI) in 2015 started falling hard. While it was doing so, it left a “large unfilled weekly gap” on...
coffee-jo-attempting-breakout-july-13.jpg (1295×677)
Below looks at Coffee ETF JO and the pattern it has been making the past few years-
1
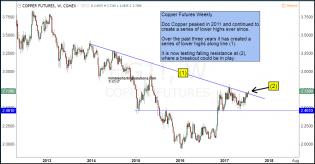
copper-futures-attempting-breakout-july-17.jpg (1296×677)
Doc Copper could be attempting to do something it hasn’t for years in the chart below.

gold-silver-monthly-testing-16-year-support-at-the-same-time-july-1...
Below looks at only Gold & Silver since the late 1990’s and why the price point in Gold & Silver are testing wha...
1

performance-spy-gold-silver-since-2001-lows-july-14.jpg (1293×675)
From 2001 until 2011, Gold & Silver both outperformed the S&P 500 by more than 500% each!
1
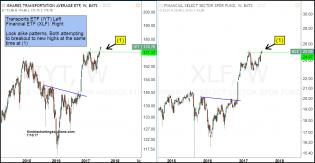
transports-and-financials-attempting-dual-breakouts-july-12.jpg...
This is good news for investors, as this could signal a fresh leg higher for stocks. Today, I’d like to zoom in...
1
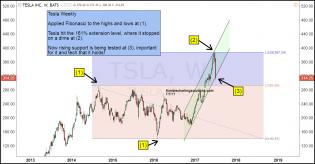
tesla-testing-support-after-hitting-fib-161-level-july-7.jpg (12...
Tesla has been white hot this year, influencing the Nasdaq and broad markets in a positive way. The rally took Tes...
3
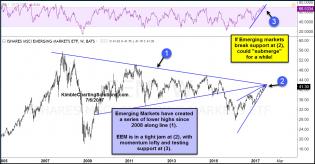
emerging-markets-testing-cluster-of-resistance-july-6.jpg (1296×676)
Emerging Markets (EEM) has done well this year, gaining over twice as much as the S&P 500 (17% -vs- 7%). These gai...
2

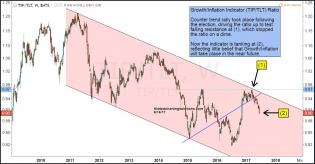
tip-tlt-ratio-testing-dual-support-after-falling-hard-june-30.jp...
Is the reflation theme now hitting a key support level and about to reverse higher as many are saying the reflatio...
1

tech-small-cap-ratio-testing-rising-support-june-29.jpg (1296×679)
The trend remains up in tech. The rally off the 2016 lows, now has the NDX testing the top of this rising channel...
4

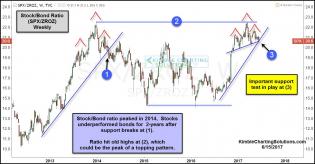
stock-bond-ratio-breaking-below-dual-support-june-26.jpg (1295×680)
Over the past 90-days, bond ETF ZROZ has nearly doubled the returns of the S&P 500. Despite the S&P doing well thi...
5

performance-zroz-vs-spy-past-90-days-june-26.jpg (1300×677)
Stocks have done well this year and the past 90-days. Which would you rather have owned the past 90-days and Year...
1
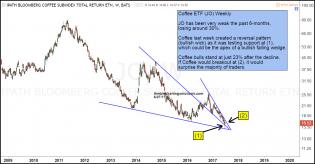
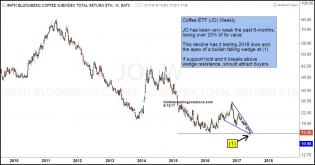
jo-testing-support-at-the-apex-of-bullish-falling-wedge-june-27....
Coffee has been anything but hot of late! Actually it has been pretty cold performance wise, as it has declined ov...
1

rsp-spy-ratio-continues-to-hit-new-lows-june-22.jpg (1299×674)
Below looks at the RSP/SPY ratio over the past 15-months
1

rsp-vs-spy-since-2009-lows-june-22-1.jpg (1296×680)
Below compares the Equal Weight S&P 500 ETF (RSP) to the S&P 500 (which is Cap Weighted), since the 2009 lows. Whi...

gold-dollar-ratio-testing-rising-support-june-20.jpg (1300×680)
Below looks at the Gold/US Dollar ratio on a weekly basis over the past decade. The ratio peaked in 2011 and has c...
joe-friday-growth-indicator-tanking-of-late-june-16.jpg (1296×676)
Post election the investment community was strong on the belief that the new administration was going to get the e...
1

tr-commodity-index-testing-30-year-support-june-16.jpg (1568×712)
Growth Indicator tanking
4
stock-bond-ratio-could-be-creating-double-top-and-hands-pattern-jun...
Below looks at the Stock/Bond ratio (SPX/ZROZ), using the two assets from above. The ratio in our humble opinion,...

tlt-attempting-breakout-above-neckline-june-14.jpg (1569×734)
Turn the table forward a year later and as of today, nearly 90% of investors are sure the Fed will raise rates…...
jo-potential-double-bottom-june-12.jpg (1293×679)
Since last November, Coffee ETF (JO) has lost over 25% of its value. Could this decline be presenting an opportuni...
1
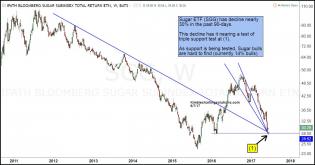
sugar-sgg-testing-triple-support-after-30-decline-june-7.jpg (12...
Sugar hasn’t been too sweet for those that have been long it for the past 90-days, as Sugar ETF (SGG) has lost a...
1

gold-facing-dual-800-pound-resistance-tests-june-9-1.jpg (1292×678)
Below looks at the Gold/US$ ratio over the past 10-years

copper-long-term-testing-falling-resistance-June-8.jpg (1570×729)
Multi-decade copper chart

copper-short-term-breakout-possible-june-8.jpg (1295×682)
Ole Doc Copper hasn’t done too well over the past 6-years, as it has created a series lower highs since 2011. Ov...

gold-dollar-ratio-attempting-6-year-breakout-june-6.jpg (1297×679)
Gold- 6-year bear market ending here?
3

dollar-gold-testing-6-year-support-may-31.jpg (1297×680)
If the Dollar-Gold ratio breaks support, it will send out its first bullish message in 6-years!

inflationary-indicator-tiptlt-ratio-continues-to-fall-may-31.jpg...
Inflation indicator breaks support, continues to fall
1
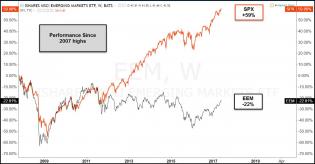
comparison-eem-spy-since-2007-highs-may-30.jpg (1295×675)
Emerging Markets; Testing 2007 breakout level again!
2

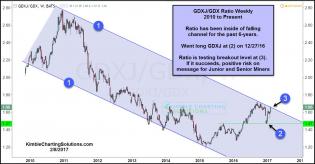
Joe-friday-gdx-going-to-breakout-of-pennant-pattern-may-26.jpg (...
Inflows and Outflows are one thing, price is another. Below looks at the price patterns of GDX over the past 8-years-
1
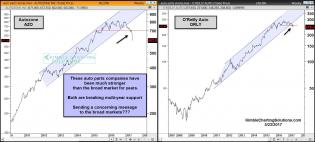
auto-parts-stores-breaking-support-may-23.jpg (1566×707)
Could auto parts companies be “Canaries In A Coal Mine” per sending a message to the broad markets?
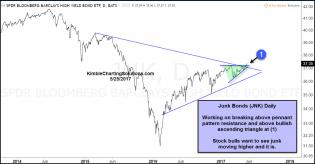
junk-breaking-out-of-dual-resistance-may-25-1.jpg (1293×674)
Below looks at Junk Bond ETF JNK over the past few years.

tlt-inverse-head-and-shoulders-may-17.jpg (1299×678)
Bonds have been hit hard since the highs around the 4th of July last year. Could this big decline, be creating a b...
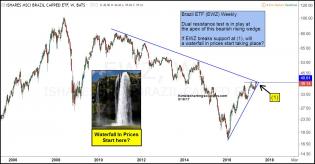
brazil-ETF-waterfall-in-prices-may-18.jpg (1295×678)
Below looks at the Brazil ETF (EWZ) over the last decade. The rally over the past year has it facing a critical le...
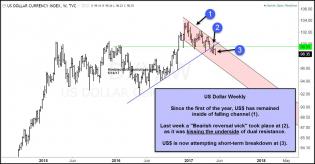
us-dollar-kissing-underside-of-dual-resistance-may-16.jpg (1300×677)
King Dollar; Breaking 3-year support, Kiss Good-Bye?
1
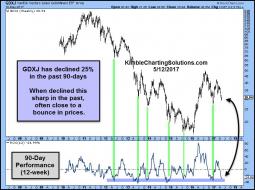
gdxj-90-day-returns-may-12.jpg (852×634)

vix-index-testing-2007-levels-dual-support-may-10.jpg (1568×735)
Fear Index (VIX); Testing 2007 level support level!

vix-at-resistance-may-9.jpg (1571×734)
Three weeks ago yesterday, the Fear Index (VIX), was pushing sharply higher, on a very small decline in the S&P 50...
1

london-creating-series-of-lower-highs-may-2.jpg (1567×734)
London; Breaking support of bearish rising wedge?
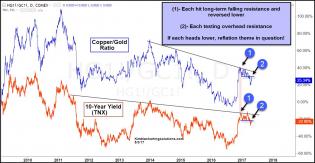
gold-copper-ratio-10-year-yield-lower-highs-may-3.jpg (1297×674)
Below looks at the Copper/Gold ratio and the yield on the 10-year note.

gold-silver-testing-rising-support-at-same-time-may-3.jpg (1299×676)
Gold isn’t the only metals asset that finds itself facing a “slipping risk!”

gold-testing-rising-support-slipping-risk-in-play-may-4.jpg (1295×676)
Today, Gold faces a “slipping risk” price point in the chart below at (3).
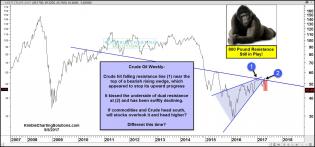
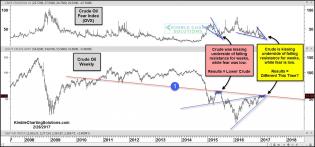
crude-falling-hard-after-kissing-resistance-may-5.jpg (1569×733)
Below looks at Crude Oil over the past decade and what is taking place after it hit an 800-pound resistance line.

joe-friday-commodity-index-hits-triple-resistance-and-turns-lower-q...
Commodity index topping pattern

Joe-friday-gdx-tests-support-as-investors-panic-april-28.jpg (13...
Gold Miners; Largest outflows in history could be bullish

crude-traders-positions-april-27.jpg (1049×578)
Sentiment on crude suggests a breakdown
1

crude-oil-nyse-correlation-high-crude-testing-support-april-27.j...
Crude oil failure setup
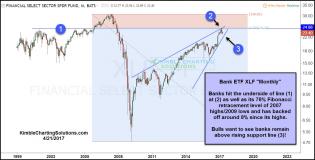
xlf-backing-off-after-hitting-fib-resistance-level-april-21.jpg...
Regional and Large banks have done well since the election. Of late they have lagged the broad market and find the...
2
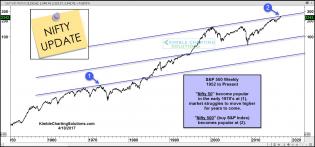
spy-nifty-50-chart-april-18.jpg (1567×736)
It was 50 stocks back then, just add a “0” today and make it the nifty 500? S&P 500 Long-Term “Weekly” Chart
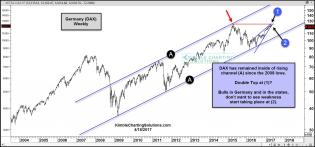
germany-double-top-sell-in-may-starting-early-april-18.jpg (1570×733)
Many times over the years, what the stock markets do in Germany and Europe, impacts stocks in the states. Several...

slv-attempting-bull-flag-breakout-april-13.jpg (1294×677)
Silver; Jumping over bull flag resistance?

spy-hits-161-fib-levels-and-backs-off-800-pound-resistance-apr-1...
Below looks at the S&P 500 over the past couple of years on a weekly closing basis. The S&P hit a key level around...
1
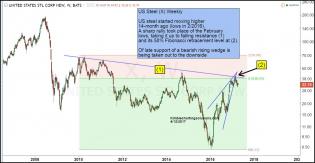
us-steel-breaking-support-after-hitting-50-fib-level-april-12.jp...
Below looks at the price of US Steel over the past few years and the message it could be sending to the reflation...
1

spy-creates-3-bearish-wicks-after-hitting-161-fibonacce-extension-a...
S&P 500; Three bearish wicks in past 6-weeks?

gold-bugs-spy-pennant-pattern-breakout-test-april-7.jpg (1297×677)
Gold bugs/SPY ratio

performance-metals-much-stronger-than-spy-ytd-april-7th.jpg (1295×676)
Since the first day after Christmas last year (12/27/16), the metals space has been a great place to be. Below loo...
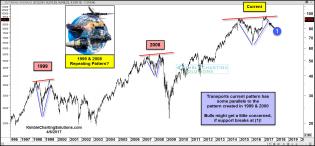
transports-could-be-repeating-1999-and-2007-pattern-april-6.jpg...
The transports are a key cog in our economy, so they also tend to be a key indicator for stocks historically.
2
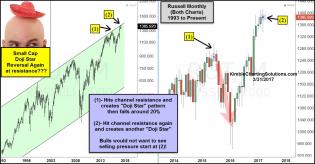
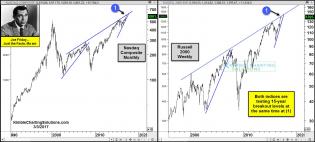
russell-create-another-doji-start-monthly-reversal-pattern-at-15-ye...
The two charts below of the Russell 2000 index might be very important to keep an eye on. Both are monthly charts...
2

xle-spy-ratio-testing-dual-support-march-30.jpg (1296×673)
Below looks at the Energy ETF (XLE)/S&P 500 ratio over the past 17-years
1

slv-gld-ratio-testing-pennant-pattern-at-falling-resistance-mar-...
Silver/Gold ratio chart
1

spy-tlt-fish-mouth-spread-march-27.jpg (1297×672)
Stocks and Bonds; Critical change of direction in play
3

spx-at-top-of-1-year-channel-and-161-fib-as-inflows-sky-rocket-marc...
Stupid retail dives in
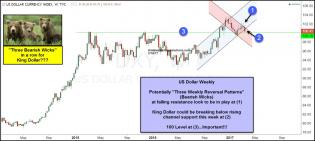
dollar-three-bearish-wicks-in-a-row-march-16-1.jpg (1500×676)
King Dollar; Three Bearish patterns in a row
1
transports-creating-repeating-1999-and-2007-patterns-march-20.jp...
Transports; Could be repeating 1999 & 2007 pattern
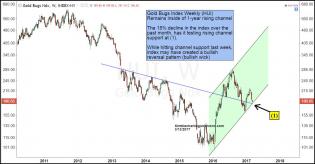
gold-bugs-index-testing-1-year-rising-support-bullis-wick-march-...
Gold & Silver Mining stocks have had a rough few weeks, falling in excess of 15%, after a sharp post Christmas ral...
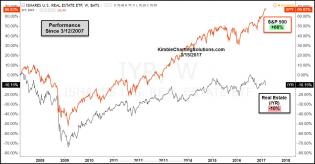
iyr-spy-performance-comparison-10-years-march-14.jpg (1296×677)
Below compares the performance of the S&P 500 and Real Estate ETF (IYR) over the past 10-years. Since the highs in...

6-pack-reflecting-small-support-breaks-march-14.jpg (1567×705)
Speaking of broken, wanted to share a few tools we look at behind the scenes, that reflect a couple of small crack...

copper-attempting-breakdown-of-bearish-rising-wedge-mar-9.jpg (1...
Doc Copper on a weekly basis-

gold-silver-ratio-testing-support-see-it-market-mar-6.jpg (1298×680)
you can see that gold has been under performing silver during this latest run. It’s sitting on key support and...
2
joe-friday-nasdaq-and-russell-testing-15-year-breakout-levels-march...
Nasdaq & Russell attempting 15-year breakouts
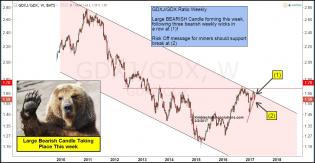
gdxj-gdx-ratio-forming-large-bearish-candle-this-week-mar-2.jpg...
The rally in the miners since the first of 2016, has the ratio testing the top of a 6-year rising channel of late.
1

xbi-leading-spx-breaking-out-of-pennant-pattern-mar-1.jpg (1297×671)
Leadership (Bio-Tech) breakout; Good sign for broad market
crude-oil-kissing-underside-of-resistance-for-weeks-with-crude-feal...
Kiss of death
3

joe-friday-crude-oil-xle-xop-turning-point-comparison-feb-24.jpg...
Energy stocks suggesting its about to fall
2
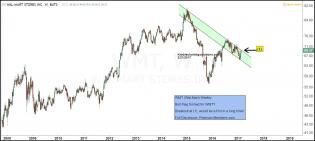
wmt-potential-bull-flag-pattern-breakout-in-play-feb-21.jpg (1501×675)
Walmart and its channel
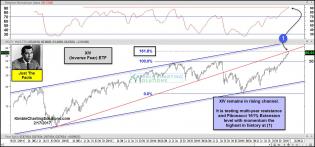
joe-friday-inverse-fear-hittingr-esistance-and-highest-momentum-eve...
A profound lack of fear
2
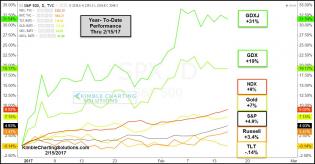
year-to-date-performance-stocks-bonds-gold-and-miners-feb-15.jpg...
Miners performing strongest

silver-gold-ratio-testing-breakout-levels-feb-14.jpg (1294×677)
Silver/Gold ratio

tip-tlt-ratio-testing-7-year-falling-channel-resistance-feb-15.j...
Inflation breakout looming
gdxj-gdx-ratio-testing-6-year-breakout-level-feb-8.jpg (1297×678)
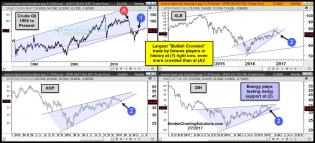
crude-oil-testing-resistance-as-most-bullish-crowded-trade-in-histo...
Crude oil - most crowded bull trade in history
2
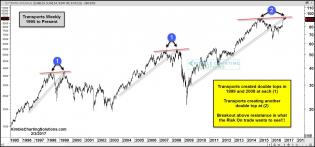
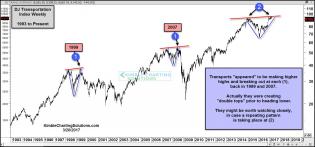
transports-could-be-repeating-1999-and-2007-pattern-feb-3.jpg (1...
Third major instance of a very bearish setup in Dow Transports
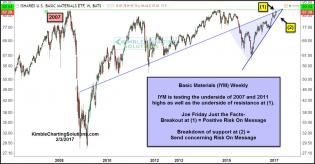
basic-materials-testing-2007-highs-feb-3.jpg (1298×678)
Basic materials repeating 2007
3

slv-gld-ratio-breakout-test-in-play-feb-1-2017-1.jpg (1499×675)
Long-term silver
7

silver-gold-ratio-form-head-and-shoulders-topping-pattern-feb-2-201...
Gold/silver ratio
1
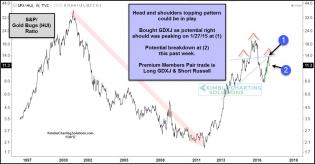
spx-gold-bugs-topping-pattern-right-shoulder-breakdown-jan-30.jp...
S&P/Gold Bugs; Completed Head & Shoulders top?

joe-friday-post-election-assets-testing-breakout-levels-jan-27-1...
Channel resistance

eufn-testing-breakout-level-jan-25.jpg (1295×678)
European financials breakout

copper-spx-ratio-testing-triple-breakout-level-jan-24.jpg (1299×679)
Copper long term

key-indices-testing-top-of-long-term-channels-jan-20.jpg (1565×682)
Sectors banging up against resistance across the board
1

nyse-daily-ad-line-trump-wants-to-hold-jan-19.jpg (756×536)
Advance/Decline line
1
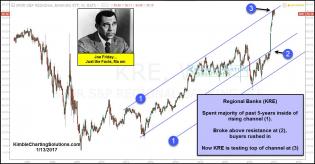
joe-friday-regional-banks-testing-breakout-level-jan-13-2017.jpg...
Banging the top of the channel for regional banks
1

gold-dollar-ratio-tests-resistance-cluster-jan-12.jpg (1300×676)
Dollar to gold ratio. I'm short gold myself.