Browse Stacks: Business: Jobs
170a5b9d44b41d4a402d5962a7bb9a33.png (1005×550)

2
payrolls revision 2025.png (1132×665)
wages-share4-24a (2)_2.jpg (550×485)
Wages' share of the economy have been in structural decline since 1975:
nhs.jpg
This is what it looks like when you pour staff and money in to a socialist/Marxist dominated organisation. The onl...

3
image_lnrtBp_l.png (640×582)
And all the kids are getting CS degrees, thinking they'll be the next Zuckerberg. God, are they going to be pissed off.
1
average-salary-for-college-gradu.jpg (624×647)
eyyiyheucaug4wt.png (688×445)
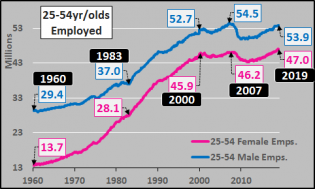
dual-income-1.jpg (695×694)
payrolls vs employment jan 24.jpg (1275×737)
1
USlifeexpectancy.jpg
US Life Expectancy.
1
weaker labor markets.jpg (686×405)
Weaker labor market allows Fed to cut aggressively
1
bfmC62D.jpg (990×652)
US unemployment is now worse than Russian unemployment...
household vs establishment dec 2022 delta.jpg (1280×754)
1
Contra Corner Why The Fed Is Gonna Break Some Serious Financial...
Contra Corner No, Joe Biden, Inflation Is Not 0.0% - David Stockman...
Nevertheless, with July’s “mere” 8.5% Y/Y increase in the CPI, real weekly wages plunged by -3.2%. That mark...
Contra Corner Why Today's Inflation Challenge Would Have Flummox...
Y/Y Change In Total Compensation Cost Index For All Private Sector Workers, 2002-2022
slopechart_RBLX.jpg
Chart a bit complicated, but it is all support and resistance.
RBLX doesn't want to quit. Right now just over pr...

2
fredgraph.png (700×768)
Employment-To-Population Ratio, Prime Age Male Workers, 1967-2021
1
2022-04-12_05-36-04.jpg (999×639)
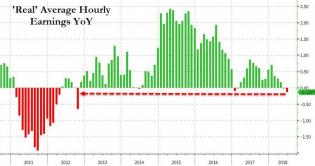
real average hourly earnings fell for the 12th straight month...
fredgraph.png (700×718)
Index of Aggregate Hours For the Goods-Producing Sector,1979-2022
2022-03-10_05-36-37.jpg (861×460)
Real wages (average hourly earnings) dropped on a YoY basis for the 11th straight month...
1
fredgraph.png (700×718)
Y/Y Change In Hourly Earnings of Leisure And Hospitality Workers, 2012-2022
5
fredgraph.png (700×718)
Index of US Unit Labor Costs, 1971-2021
resignation1-22.png (500×481)
2
earnings2.jpg (994×659)
Real wages are SHRINKING
1
earnings1.jpg (1280×908)
Inflation beating wage growth
2021-12-08_11-58-41.jpg (1056×617)
Finally, the number of U.S. job openings exceeded the number of unemployed Americans by the most on record in October...
2
fredgraph.png (700×718)
Y/Y Change In Retail Wages & Salaries
Economic-Prosperity-5-year-avg._0.png (771×434)
fredgraph.png (700×718)
Real Hourly Wages Versus Unit Labor Costs, 1972-1995
1
bfmA873.jpg (971×562)
NBER Tells 14 Million Jobless Americans That The Recession Officially Ended In April 2020, The Shortest Ever
ft_2020.11.09_retirements_01.png (840×790)
Rise in retirement for boomers
2021-07-15_7-13-15.jpg (713×646)
What Reasons Do The Unemployed Give For Turning Down A Job?
1
fredgraph.png (700×718)
Employment-Population Ratio, White Men 20 Yrs. and Over, 1954-2021
2
fredgraph.png (700×718)
Employment-Population Ratio, Men, Women and All, 1948-2021
fredgraph.png (1168×570)
Real Median Family Income, 1954-2018
job openings 1 month change_0.jpg (1199×740)
Nobody Wants To Work: Job Openings Soar To All Time High 9.3 Million As Record Numbers Quit Their Job
fredgraph.png (900×570)
Paying workers to not work..........which is why hiring is so weak.
1
Chart_of_foreign_born_in_the_US_labor_force_1900_to_2007.png (888×761)
3
2021-03-22_12-12-06.jpg (500×662)
6
jobs added 3.5.jpg (1280×842)
Bull market in bartenders
slopechart_ACB.jpg
cup and handle ACB stack

1
Productivity-Employment-PopRatio-2019-111120.png (979×589)
payrolls 2020-11-06_8-31-31.jpg (800×457)
Alternate Unemployment Charts
1
wages-share-income7-19a_1.png (550×468)
fredgraph.png (950×720)
1
US-unemployment-claims-2020-09-03-continued-state-federal-NSA-stack...
fredgraph.png (950×720)
1
4-9.png (1260×758)
1
slopechart_FR:MCUMFN.jpg
Monthly manufacturing capacity utilization. Just another "V" recovery like 3 of the last five recessions?

3
young unemployment rate.jpg (1217×887)
2
emp to pop.jpg (1203×885)
not in labor force 2.jpg (1169×881)
db jobs 1.jpg (1195×886)
slopechart_GEO.jpg
Prison REIT yields 16%. Green trendline starts on 12/18/2000 @ 59 cents
sitp1fgwukx41.jpg (1552×802)
1
Contra Corner And They're Gone! The Obscenity Of Dr. Fauci's Job...
Jobs in leisure/hospitality sector has dropped to levels not seen since 1988!
1
Contra Corner And They're Gone! The Obscenity Of Dr. Fauci's Job...
All the jobs created since the 20th century ended have vanished.
1
GS labor market slack.jpg (847×536)
MS jobs recovery.jpg (1041×596)
bfmC047.jpg (976×510)
slopechart_/NQ.jpg
The orange rectangle highlights a chart pattern known as a throwover.
2
bfm952C.jpg (978×505)
1
Employment-FullTime-16-54-041420.png (869×525)
4
2020-04-16_4-59-00.jpg (434×332)
3
bfmB498.jpg (976×507)
22 Million Jobless Claims In 1 Month: Last 4 Weeks Erase All Jobs Created Since The Great Recession
2
Contra Corner The Cult Of The Dow And The Senate's Night Of Infa...
2
40246456-15780999585046003.png (617×306)
novpayrolls.jpg (884×523)
wage-inequality12-17_1.jpg (548×457)
3
MiddleEarth.jpg
Middle Earth rises! Chart promoted by Ivanka Trump tweet.
asset prices vs po.jpg (750×450)
2
chartoftheday_14435_how_productive_is_an_hour_of_work_n.jpg (960×684)
Brexit.jpg
Yet another estimate.
jobs.jpg
If those are all the jobs affected by Brexit which I very much doubt. What are they waiting for?
3
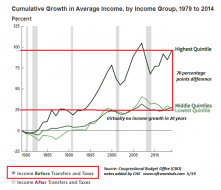
CBO-income-before4-19.png (550×471)
Economist-Cover.jpg (409×536)
3
lend 2.png (835×670)
download (4)_26.png (482×290)
2019-04-09_9-55-03.jpg (787×489)
Jobless-Claims-Continued-4wk-Avg-021119.png (814×504)
2019-02-22_8-02-50.jpg (890×463)
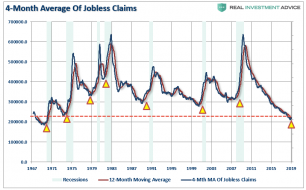
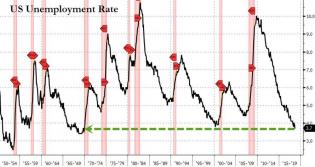
According to Lavorgna, since 1948, the economy has always entered or been in a recession when the unemployment rat...
1
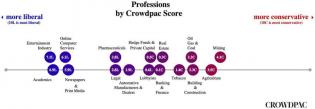
cp1.jpg (890×309)
Occupations and Politics
3
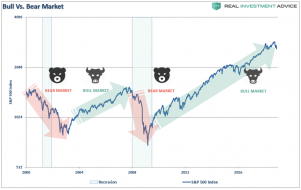
SP500-Bull-Bear-Market-112618-2.png (890×561)
@MS it's suttle. You not so much! LOL
Car Talk: @F and plastic parts: https://www.youtube.com/watch?v=3fn1pu5rP...
2018-11-02 (1).jpg (890×472)
2018-11-02.jpg (890×469)
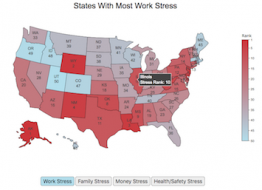
Most Stressed States - Engaging Data
Work stress
1

wwg.png
The widening wage gap. This isn't just happening in America. This is happening throughout the developed world. Def...
2
2018-10-02_12-52-44_0.jpg (890×473)
1
download (8)_11.png (559×342)
download (5)_15.png (482×304)
2018-08-28_7-07-39.jpg (890×470)
1
2018-08-22_12-13-17.jpg (890×468)
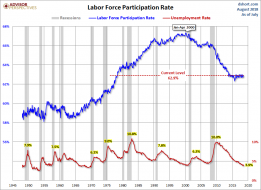
LFPR
2018-08-03_5-57-31.jpg (890×471)
9 aug1.PNG

1
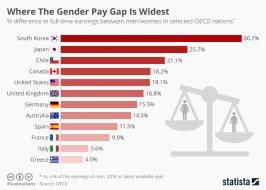
Infographic: Where The Gender Pay Gap Is Widest | Statista
Alternate Unemployment Charts
The ShadowStats Alternate Unemployment Rate for April 2018 is 21.5%.
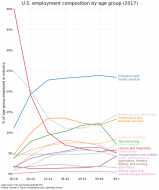
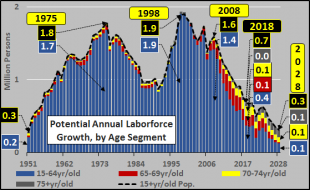
us-employment-by-age.png (773×922)
How Americans make a living based on their age