The Chaikin Oscillator is intended to unveil underlying accumulation or distribution of any financial instrument for which volume is available. This applies to stocks and ETFs, for example, whereas it will not produce meaningful data for mutual funds or cash indexes, since they lack volume data.
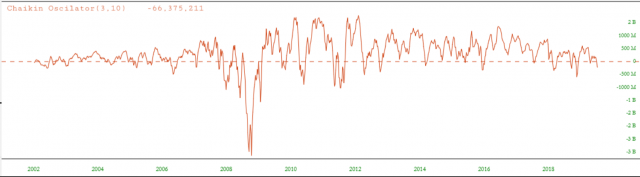
This is an “indicator of an indicator”, since it calculates the difference between two exponential moving averages of the accumulation/distribution line. The Chaikin Oscillator for the SPY, for example, looks like this:
When you add this study from the Technical Studies dialog box, you will be presented with three points of control: the number of days for the first average, the number of days for the second, and the color you would like to use. The default settings are presented, and you can either type in different figures or use the slider bar to change them.
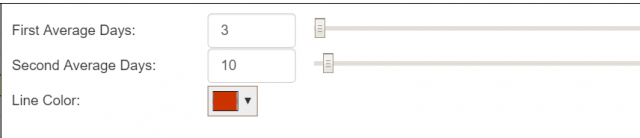
If you use the slider bar, you will see the changes take place instantly.
There are a couple of ways to apply this study. One is via a crossover, with a focus on the “0 line” represented by the horizontal. In the example below, using the symbol SPY, we see several instances of buy signals (green tint, when the Chaikin crosses above the 0 level) and sell signals (magenta tint, when the Chaikin crosses beneath the 0 level).

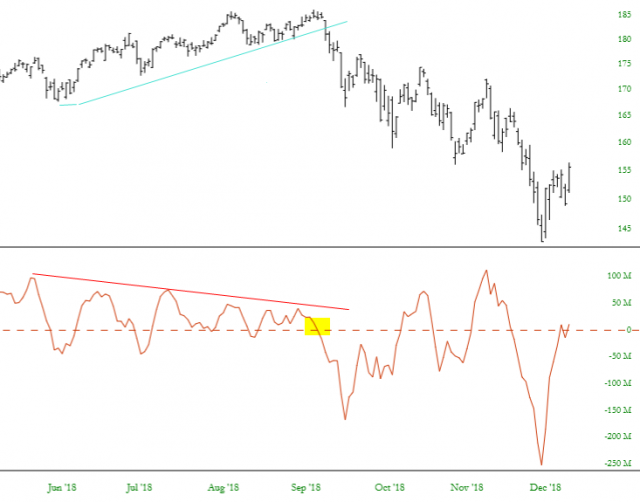
You can also gain insights into “stealth” accumulation or distribution by watching for divergences. In the example below, the QQQ was steadily moving higher in the middle of 2018. However, the Chaikin Oscillator was downtrending (note the red line). At the same time, the indicator slipped below the 0 line. An owner of QQQ who heeded this signal would have sidestepped a substantial drop in price in the months that followed.