The DeMarker Indicator was created by famed technical analysis Thomas DeMark, and it is used as an overbought/oversold indicator. The range of the line chart is from 0.0 (most oversold) to 1.0 (most overbought). In SlopeCharts, we have helpfully provided shaded portions of the graph to make it very clear when the indicator enters and exits either of these zones.
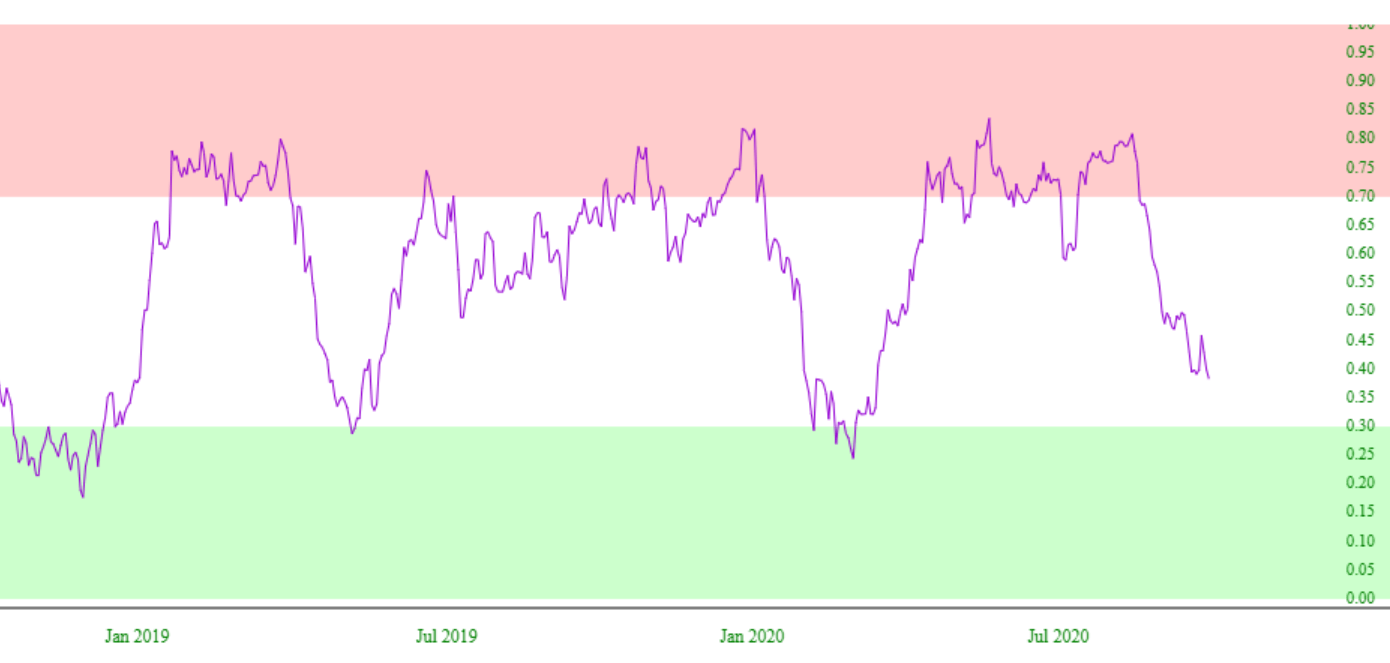
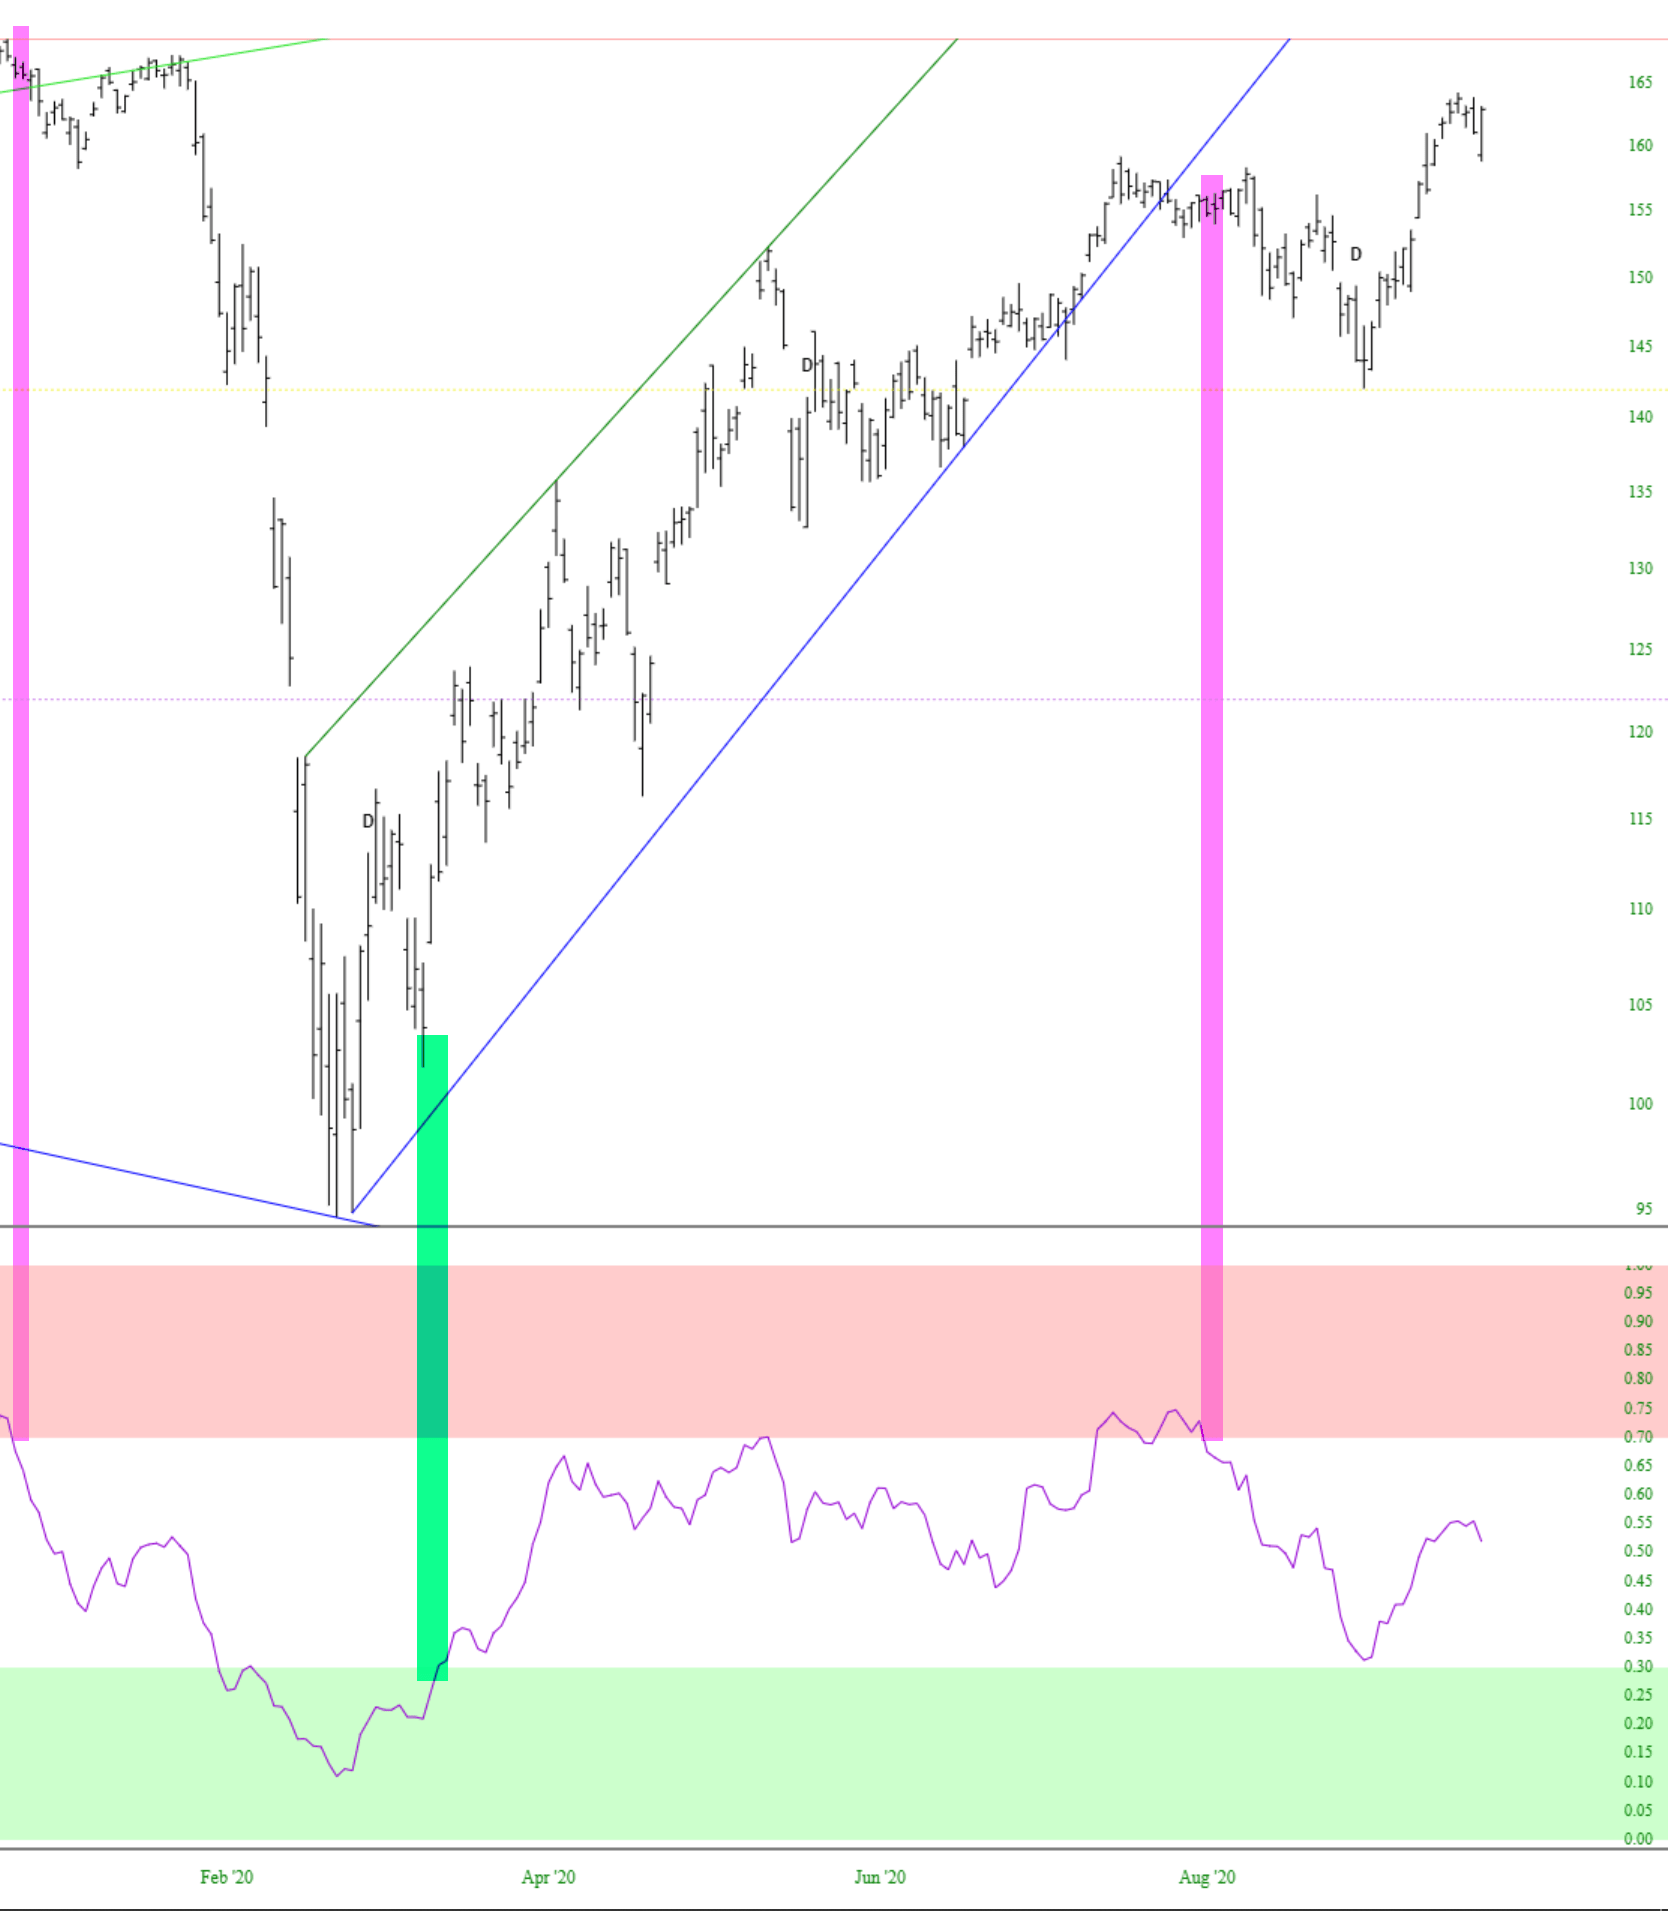
The typical period for this indicator is 14 days, although it can be set to anything you like. In the simple example below, there are two “sell” instances (tint added in this illustration to make clear of the indicator signal as it relates to the actual security price) and one “buy” instance. Both of the “sells” were valid signals, although the first one was early and the second one wasn’t particularly long-lasting. The buy signal, however, seems to have been quite prescient.
By increasing the number of days used in the calculation, you can make the signals less frequent. Below, for example, is a 50-day version, with each of the crosses above the “30” level marked as a buy. There are six instances here, five of which appear to have been effective.
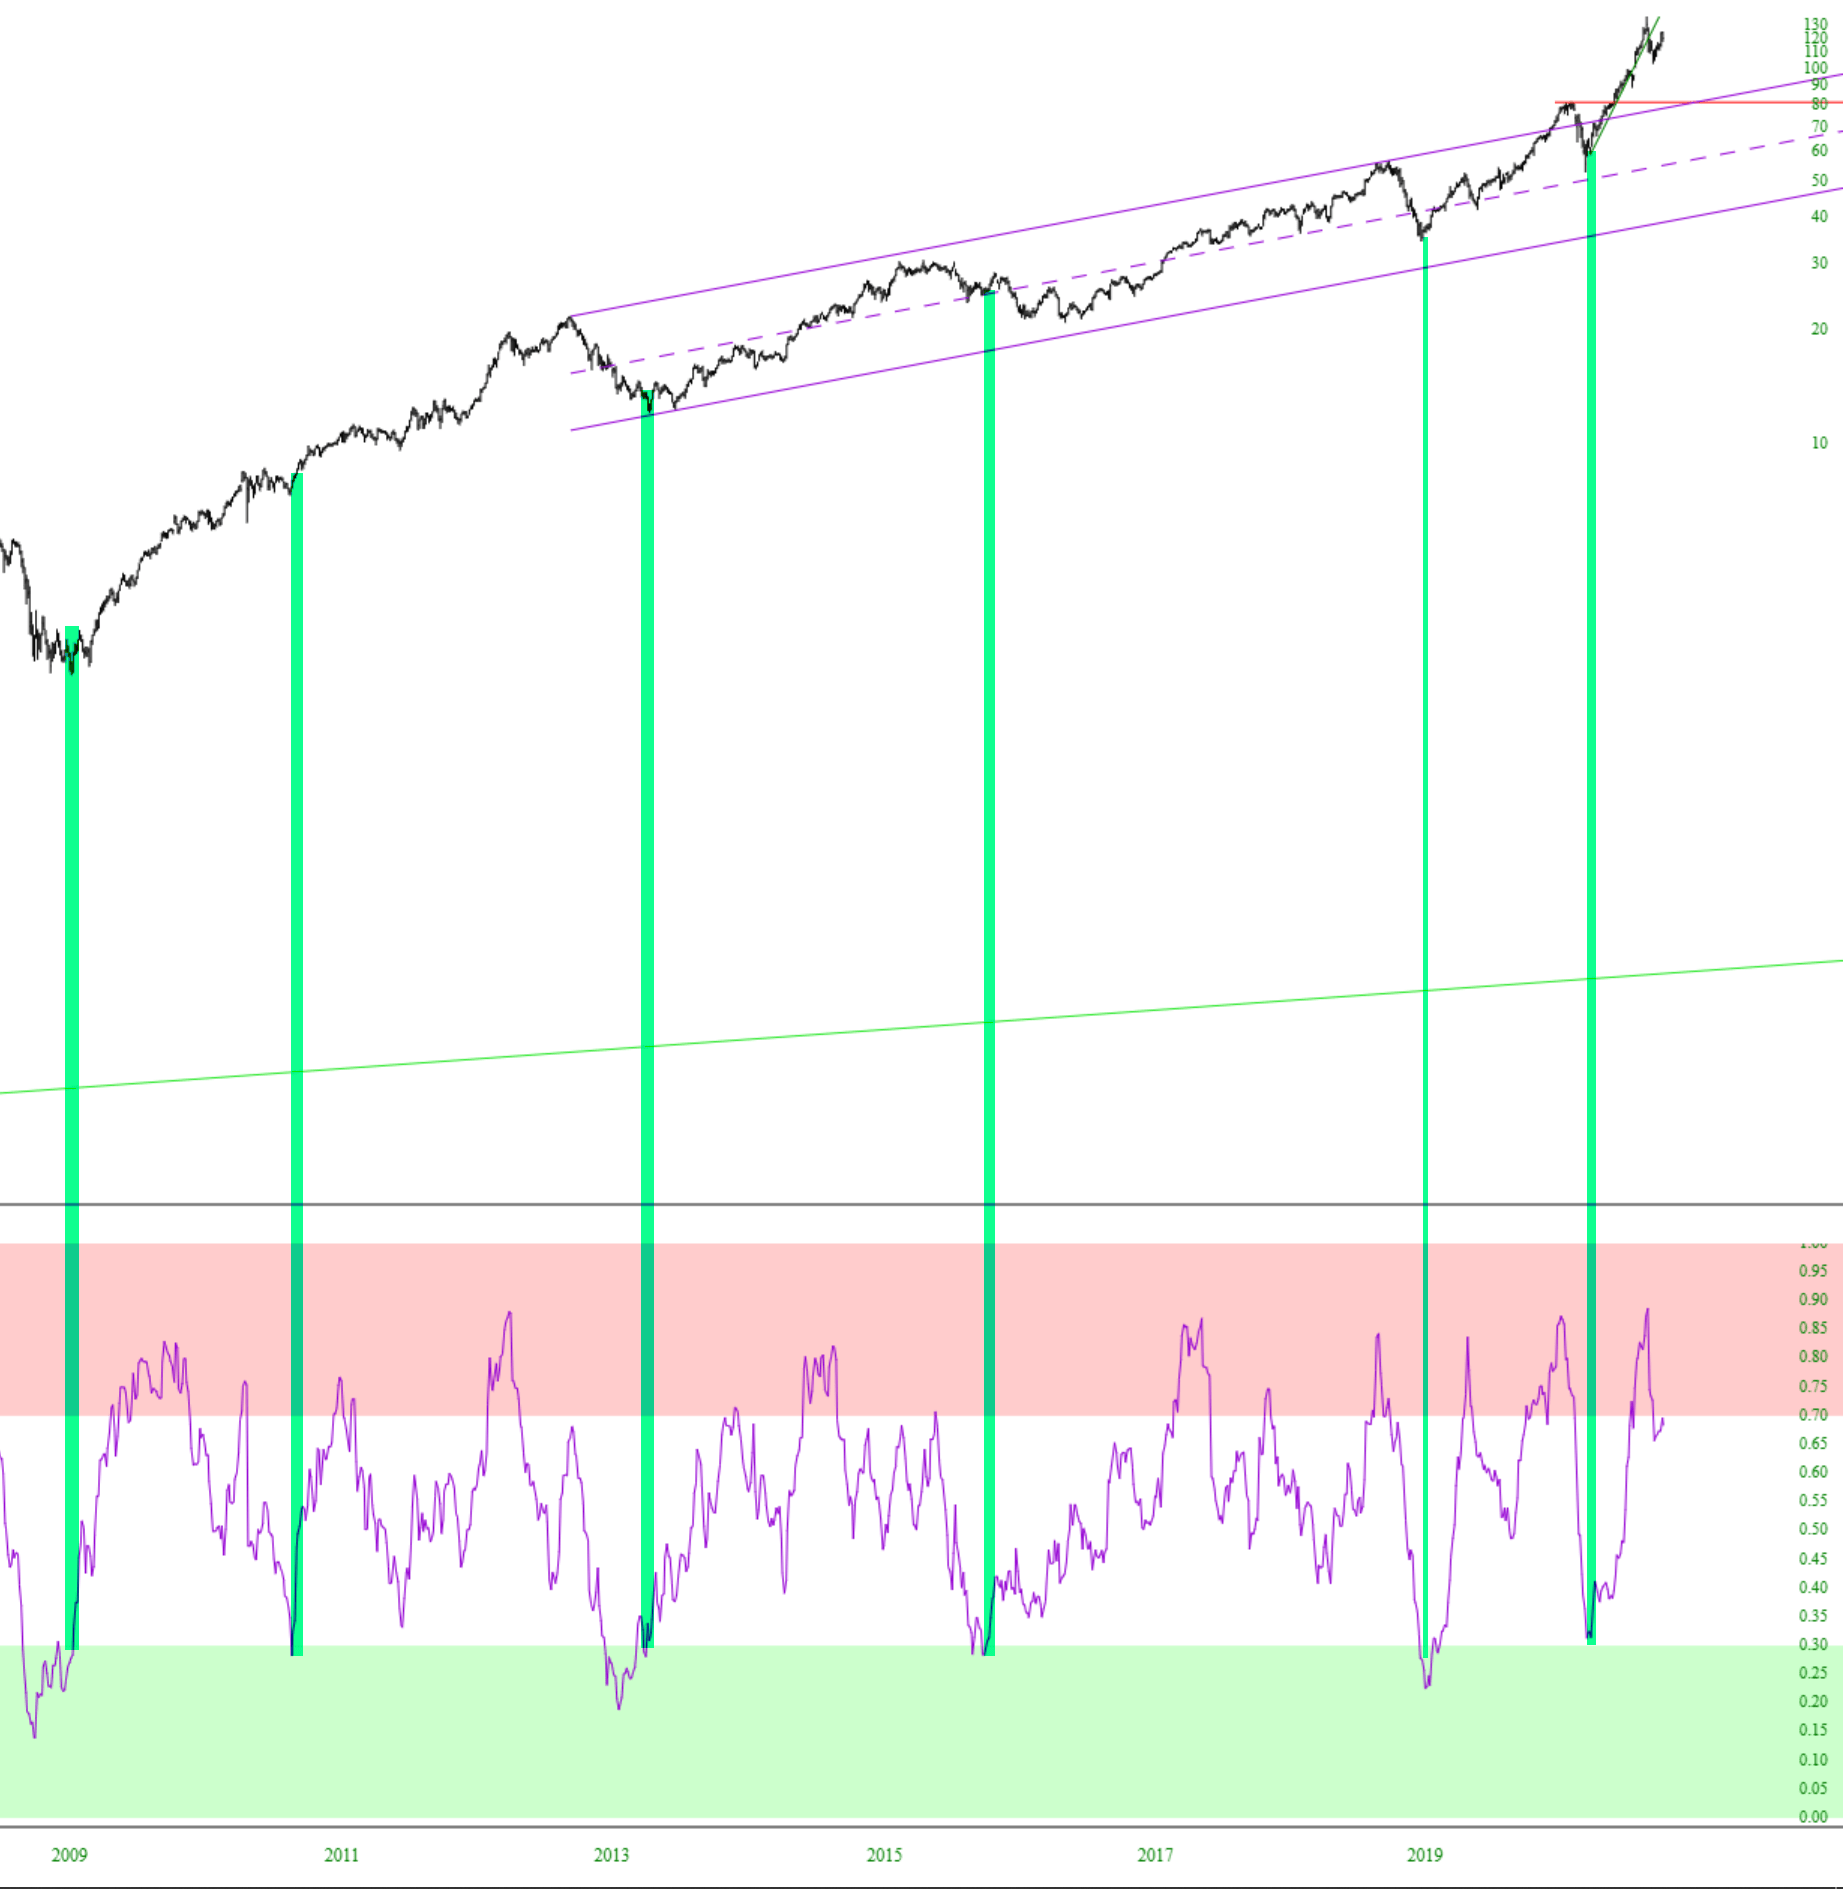
The sell signals were less successful, although since this was a generally up-trending security (in this instance, Apple) it at least did a good job in predicting those instances in which AAPL did, in fact, had a selloff.
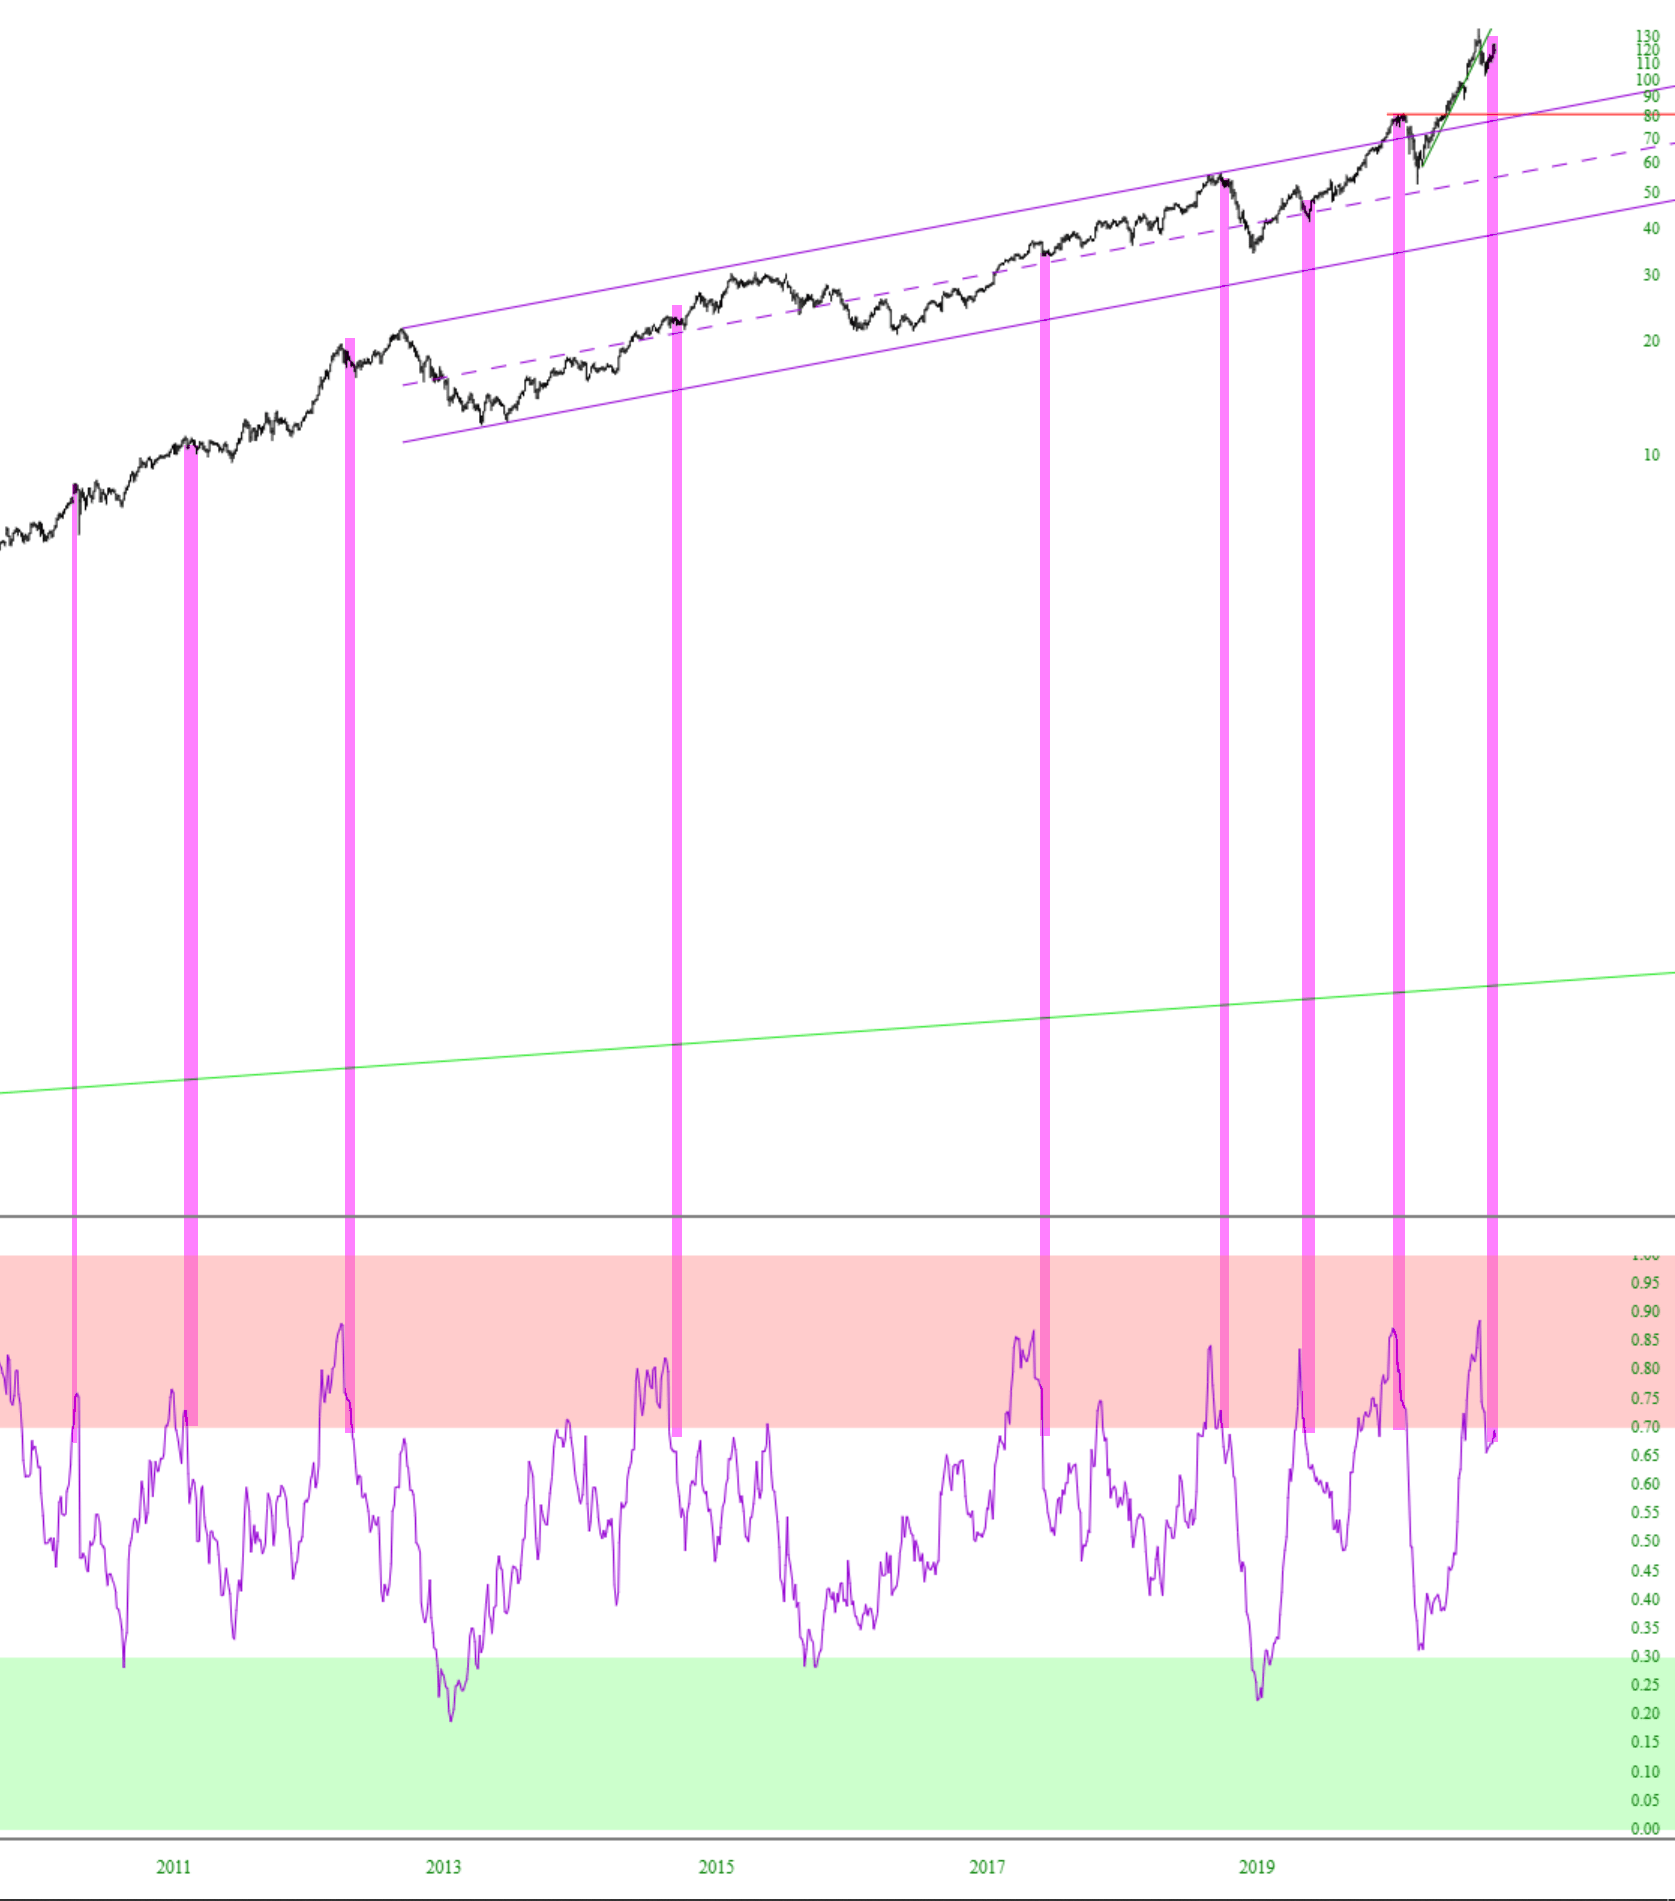
Some Slopers have found the DeMarker to be a more reliable indicator than studies such as the CCI, but your own experimentation will be the most helpful in garnering insights into how well this indicator does with your own securities.
