As explained by Investopedia, “The volume weighted average price (VWAP) is a trading benchmark used by traders that gives the average price a security has traded at throughout the day, based on both volume and price. It is important because it provides traders with insight into both the trend and value of a security.” Here is where you will find it in Technical Studies:
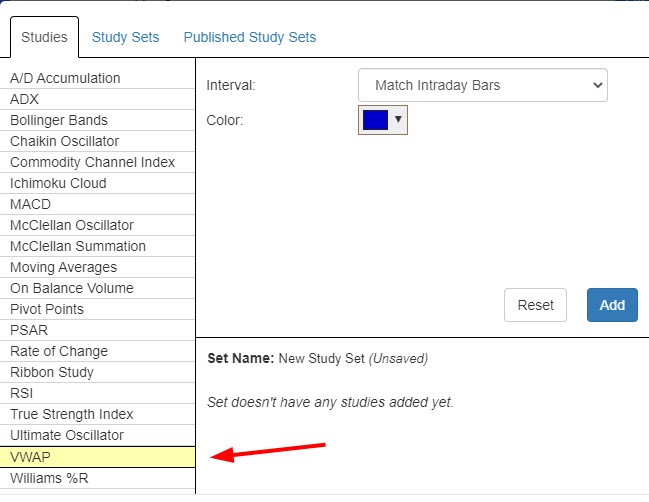
This indicator only works with intraday charts, so only those of you with access to intraday data (Silver, Gold, and Platinum members) will be able to make use of it.
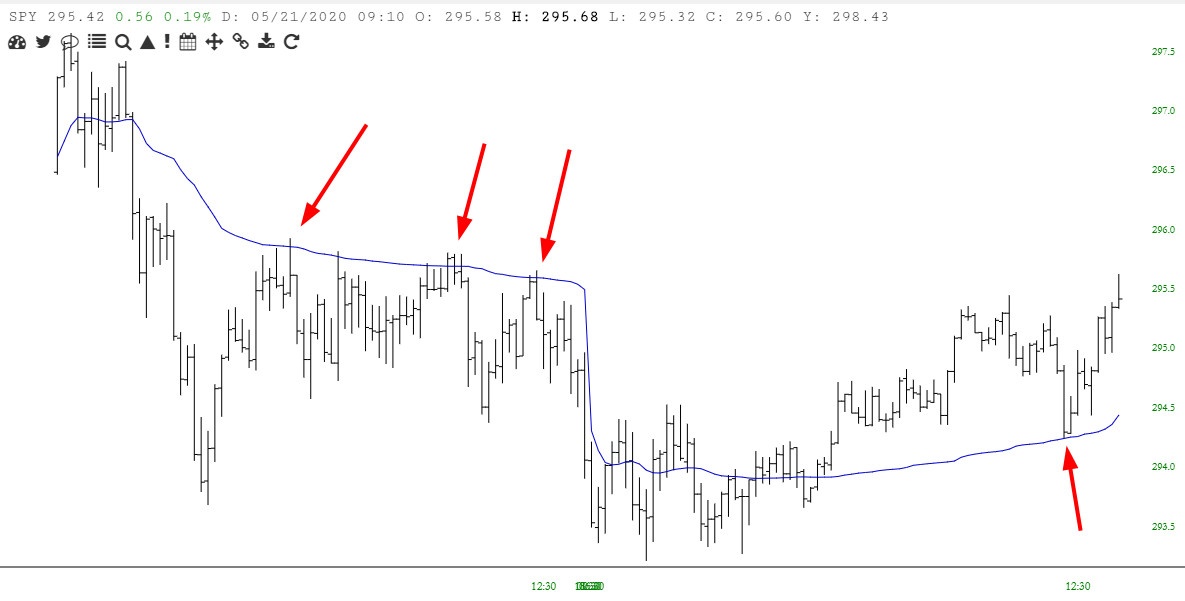
Here is an example of the SPY being repelled and, later, supported by the VWAP:
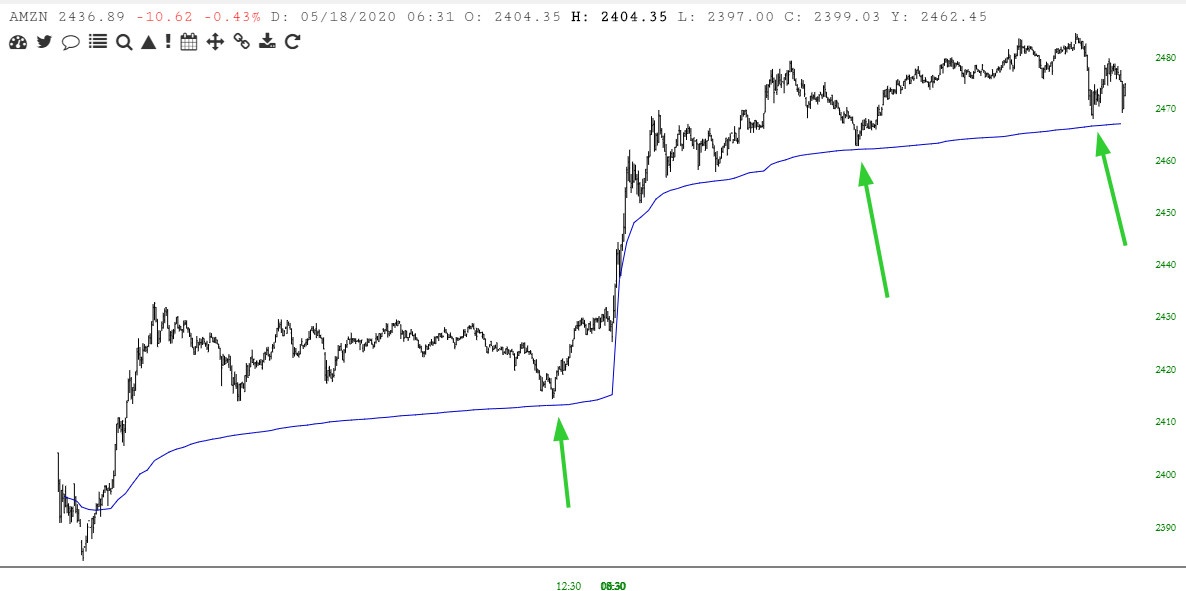
Here is some recent trading activity from Amazon; the VWAP plainly marks a good “bounce” point:
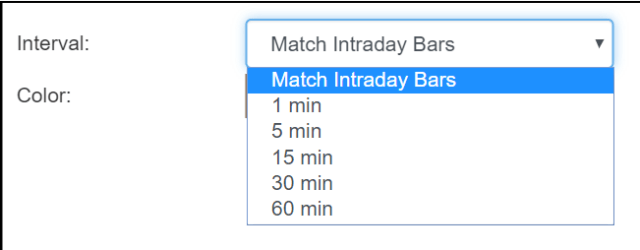
By default, the VWAP calculation will match whatever intraday bars you are using. For instance, if you are using 1 minute bars, the VWAP will likewise be based on 1-minute granularity of data.
You can override this, however, in the Technical Studies by way of this dropdown menu. You can also alter the color of the VWAP line chart in the area just beneath this dropdown.
As further explained in the Investopedia description, “Large institutional buyers and mutual funds use the VWAP ratio to help move into or out of stocks with as small of a market impact as possible. Therefore, when possible, institutions will try to buy below the VWAP, or sell above it. This way their actions push the price back toward the average, instead of away from it.“
To see what Slopers in the comments section have been saying about VWAP, check out the archives located here.
