Date: February 8, 2014

$VXNsc.png
Another potential sign THE top is in. Take care. Enjoy the day. T.


20140208_long5.png (1242×881)
Crude oil since 1860

20140208_long4.png (1238×887)
Gold prices since 1790
2

20140208_long3.png (1240×882)
Commodity prices since 1790

20140208_long1.png (1241×881)
Stocks since 1789

New Weekly Markets Analysis PDF file.
Updated charts analysis...
Discussing about the $SPY in the Weekly Markets Analysis http://marketzone.tumblr.com/post/76023828608/new-weekly-mar...

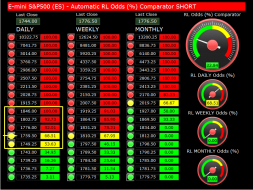
ES SHORT

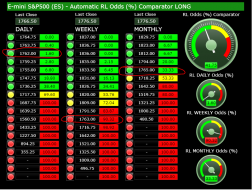
ES LONG
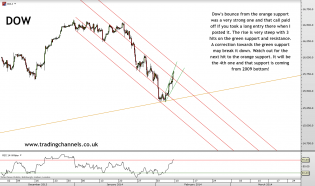
Trading channels: Weekend charts
How far does the bounce go?

4