Chart the future by seeing the past clearly.
For immediate access, get your free account here, or, if you already have an account, log in here
SlopeCharts is the most intuitive and easy-to-use platform for financial charting.
Highlights of the product include Future Price Projection, Seasonality Graphs, Automatic Trendlines, Options Volatility, Candlestick Finder, Price/Volume Filtering, Sectors and Sub-Sectors, and an amazing Economic Database.

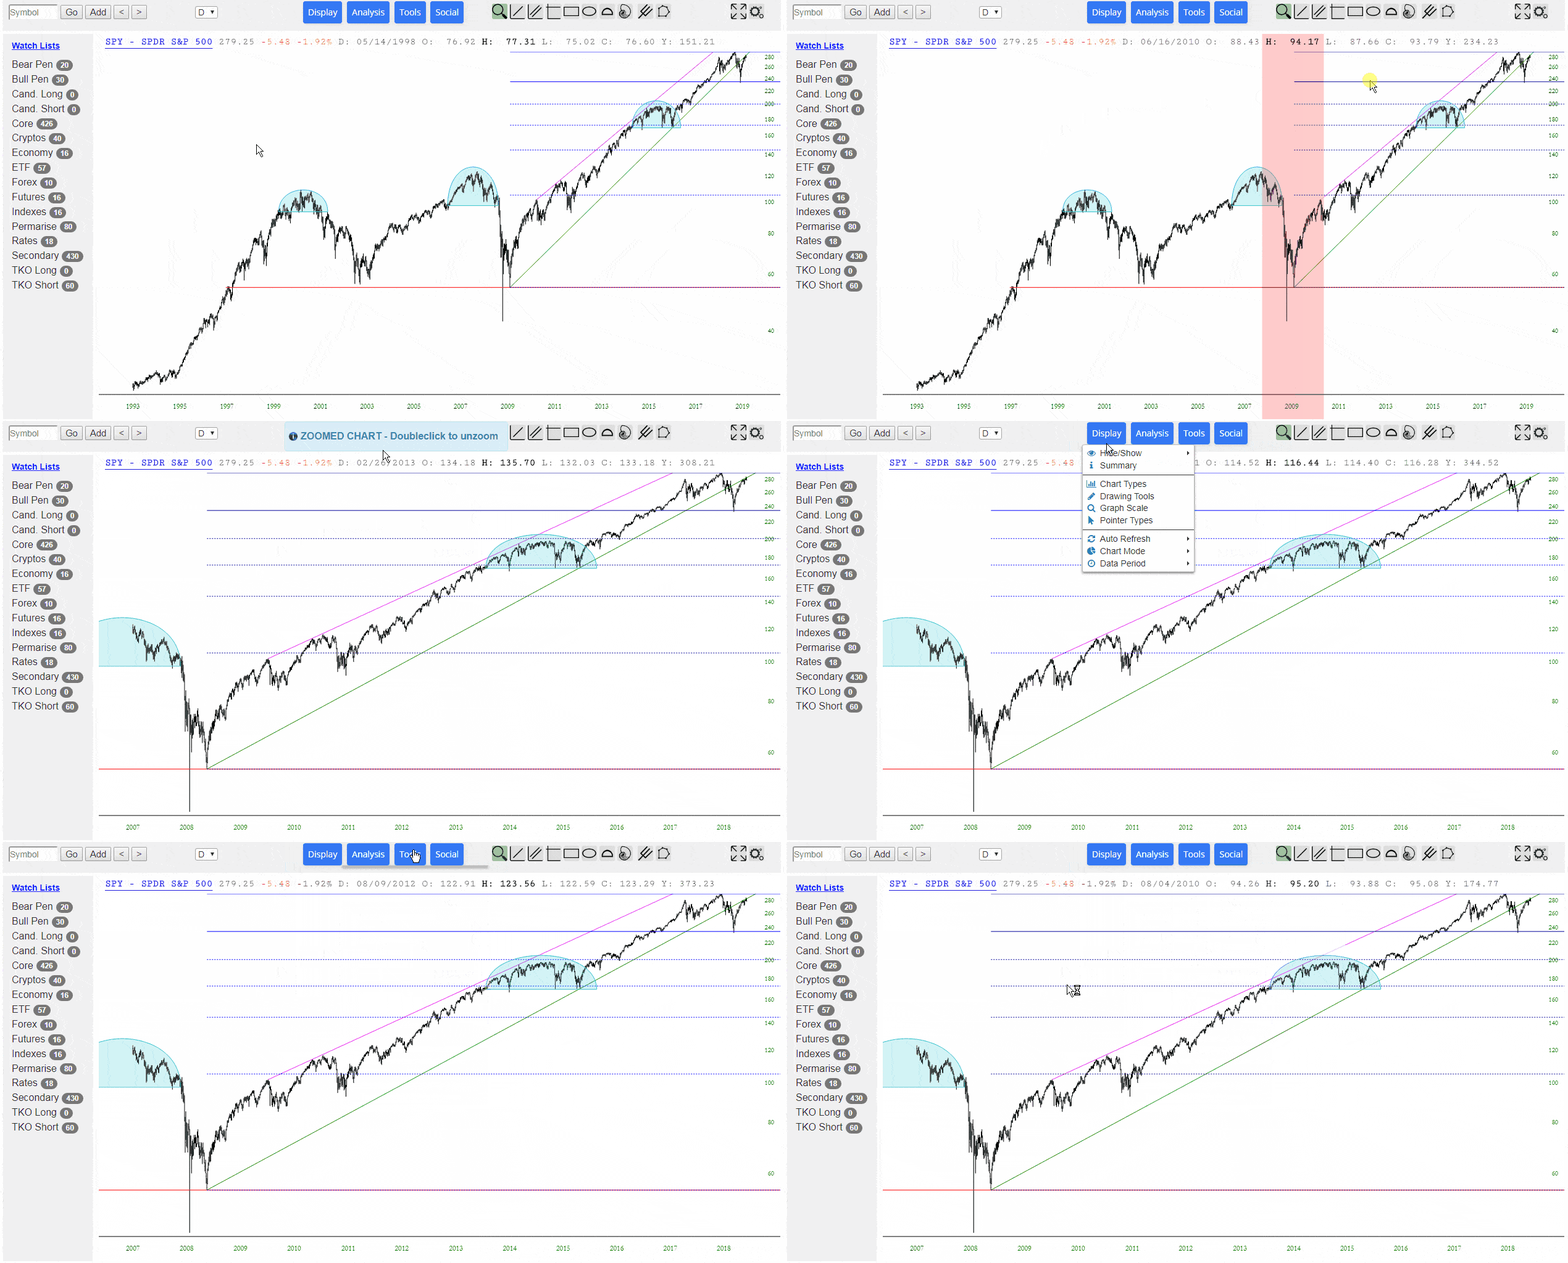
Chart Your Way to Profits
(1) Easy to Use: Using SlopeCharts is intuitive, simple, and a breeze to learn.
(2) Organized: There is no charting product in the world that comes close in watch list management, which is how you keep your trading world and best ideas in good order.
(3) Patterns-Focused: History tends to repeat itself, and you can spot those repetitions here, particularly with the built-in automatic trendlines and projection of future price trends.

Options Analytics
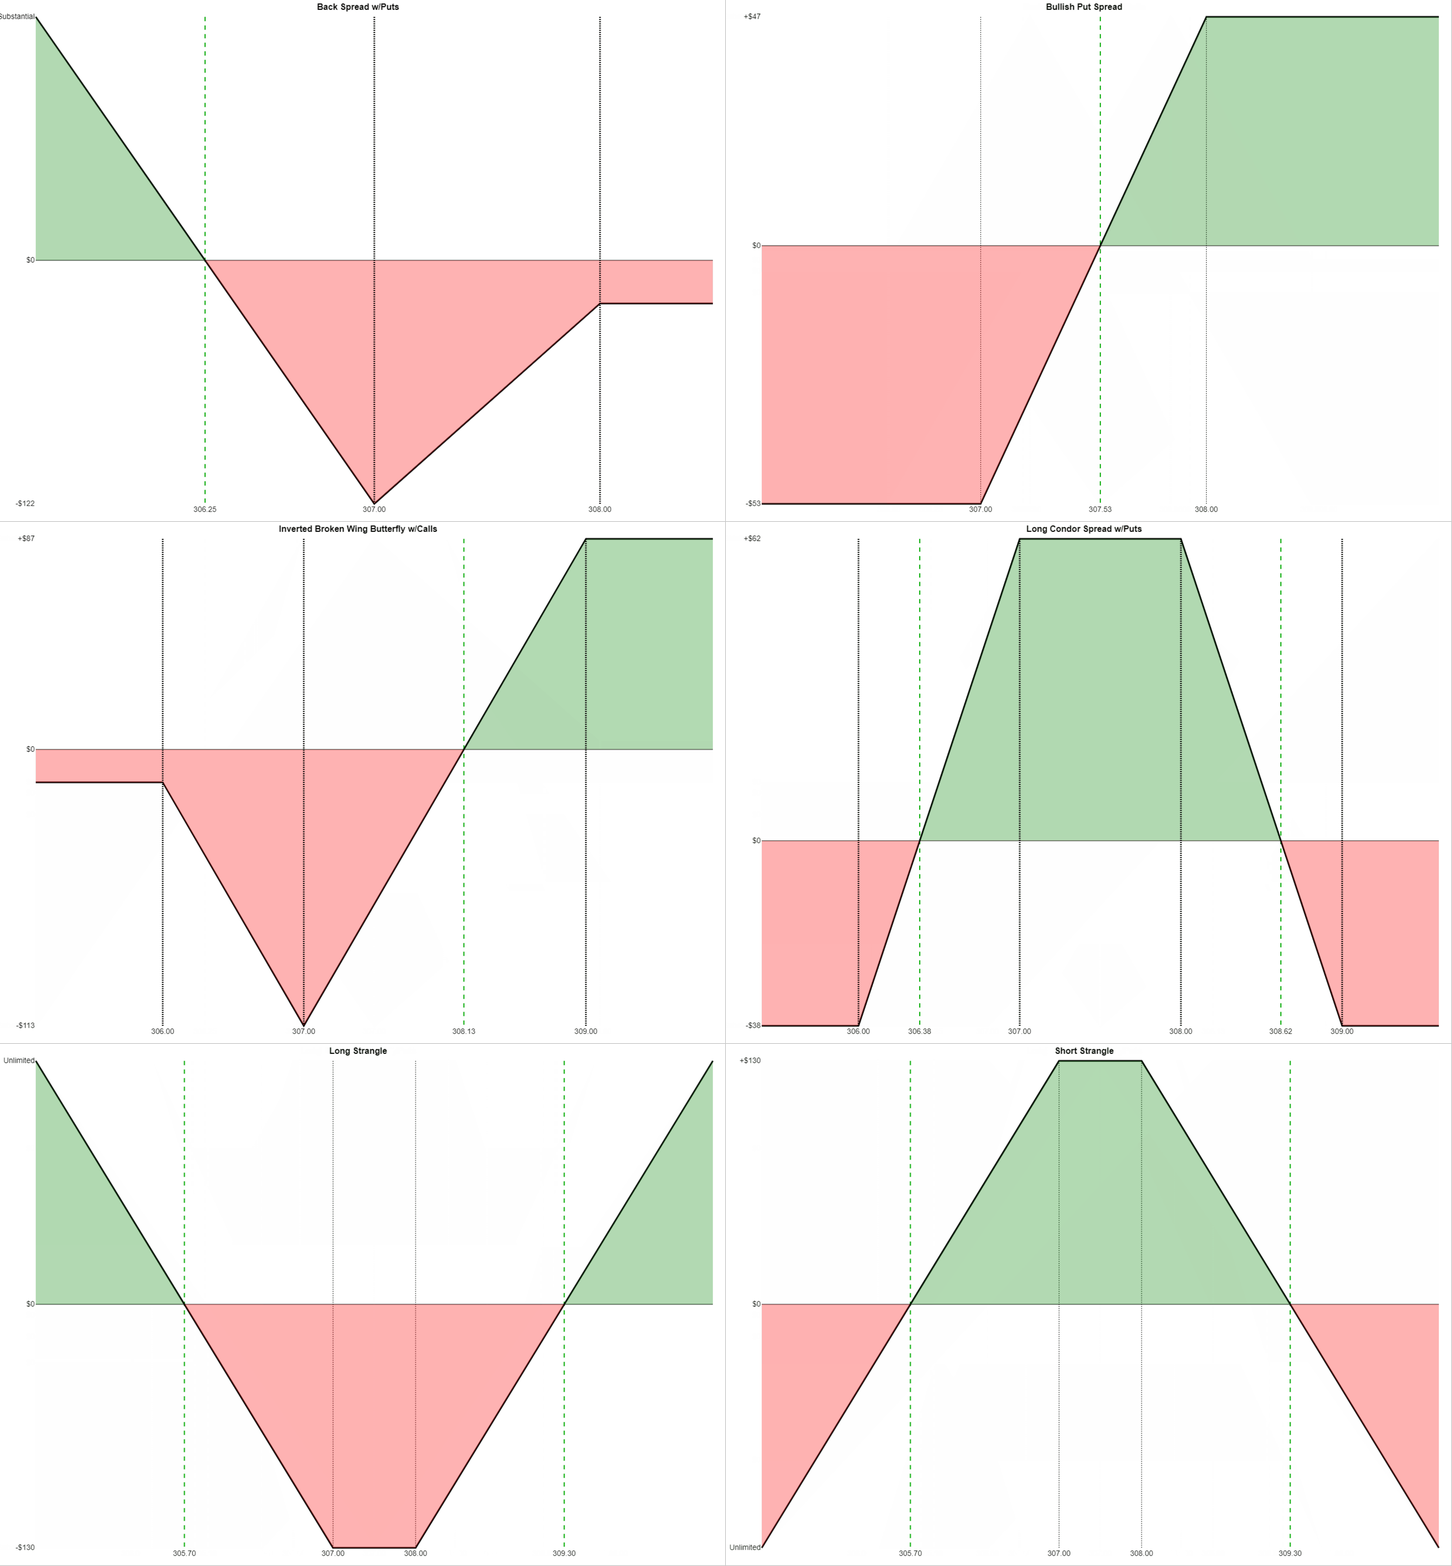
Options are the most popular trading instrument among Slope of Hope users, so it is a major focus for this site. There are a number of products on Slope designed to help options traders in their exploration and analysis, such as the payoff graph, volatility charts, price change charts, earnings reaction charts, and the exclusive OptionDots system, built directly into SlopeCharts.

Centuries of Historical Data
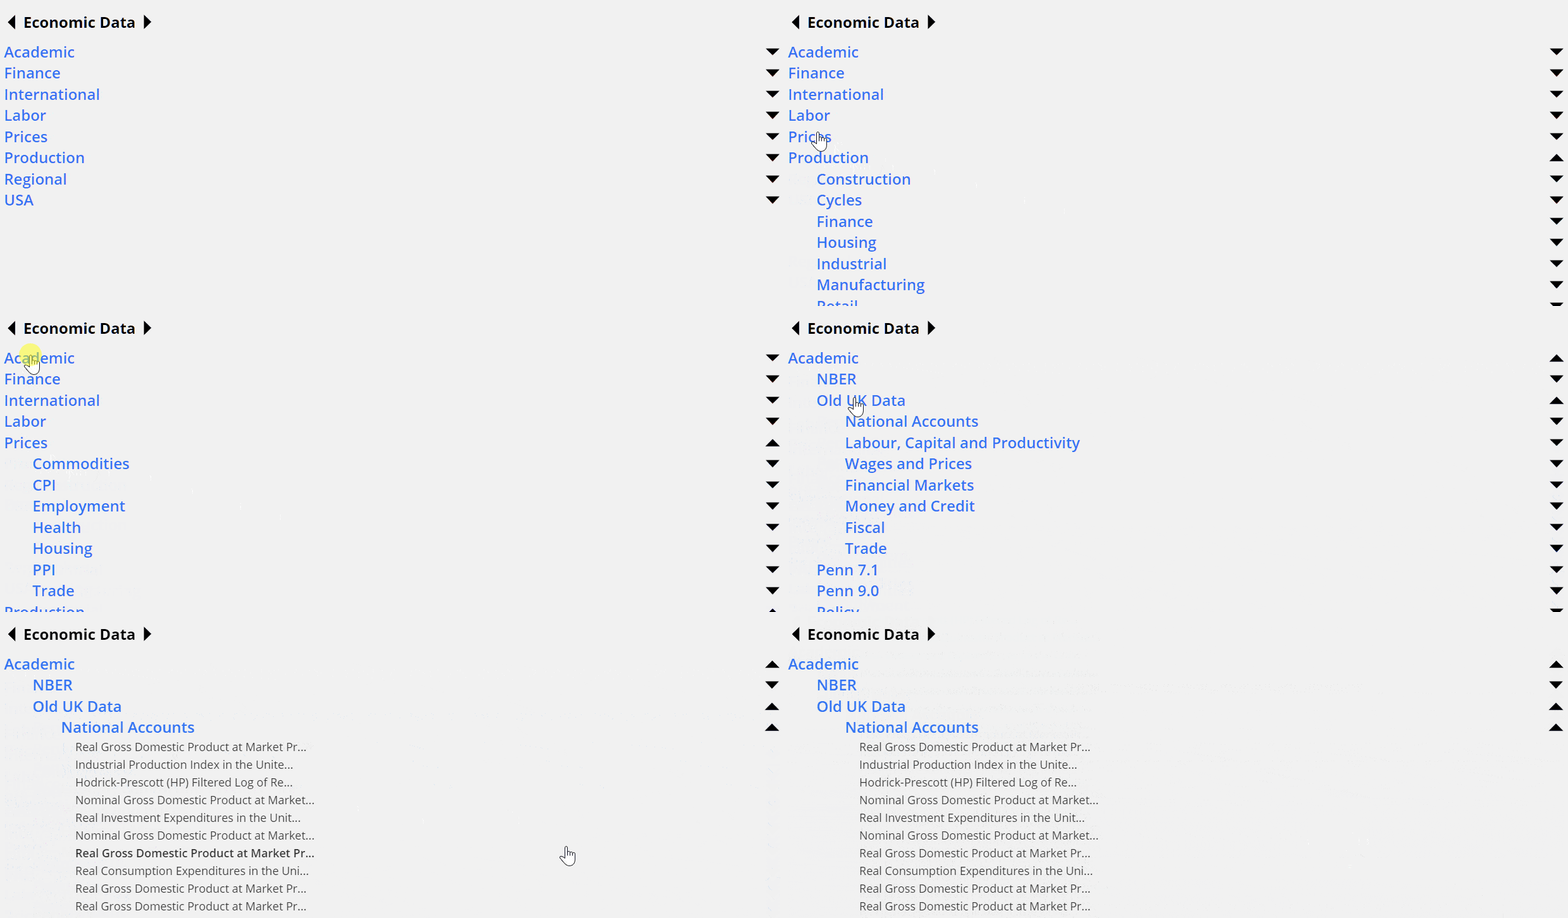
There is no other charting platform on the Internet with such a wide scope of financial history and economic data. Whether you are looking at interest rates from the 17th century or cryptocurrencies from the 21st, SlopeCharts has it all. All the information is accessible via an in-depth, easy-to-understand data explorer.

Dynamic Tools for Visual Traders
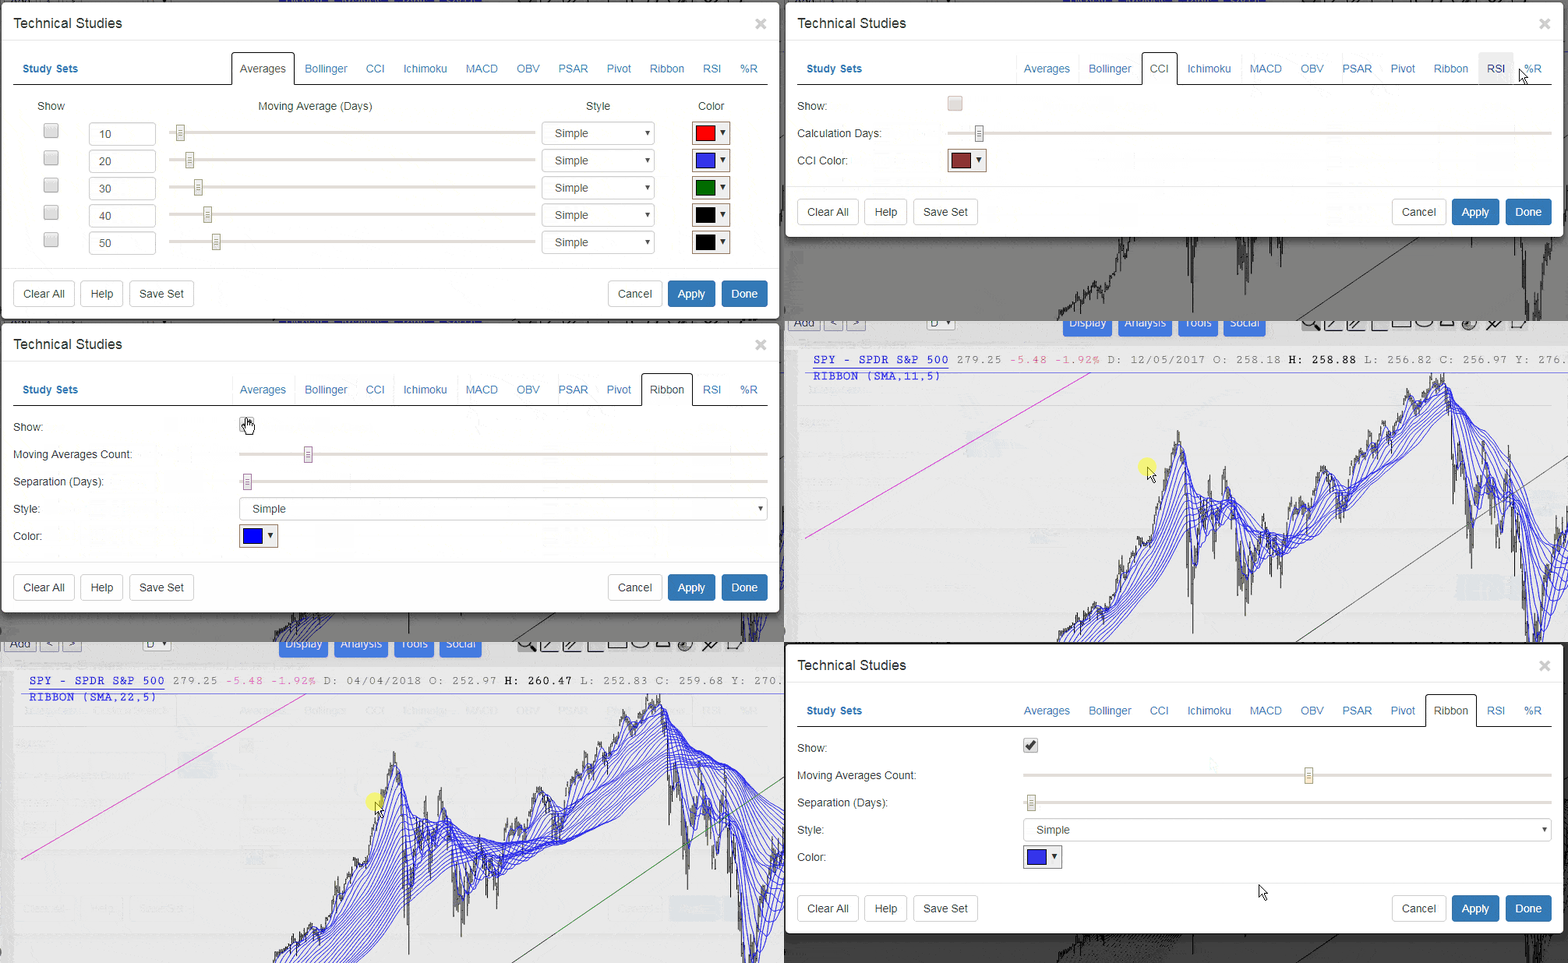
One unequaled tool in SlopeCharts is the ability to actually see the studies in an animated, real-time simulation by way of a dynamic slider. Instead of simply guessing the most useful parameters, you can instantly witness the effect of changing settings on the chart itself and decide what to choose as the most appropriate parameter.

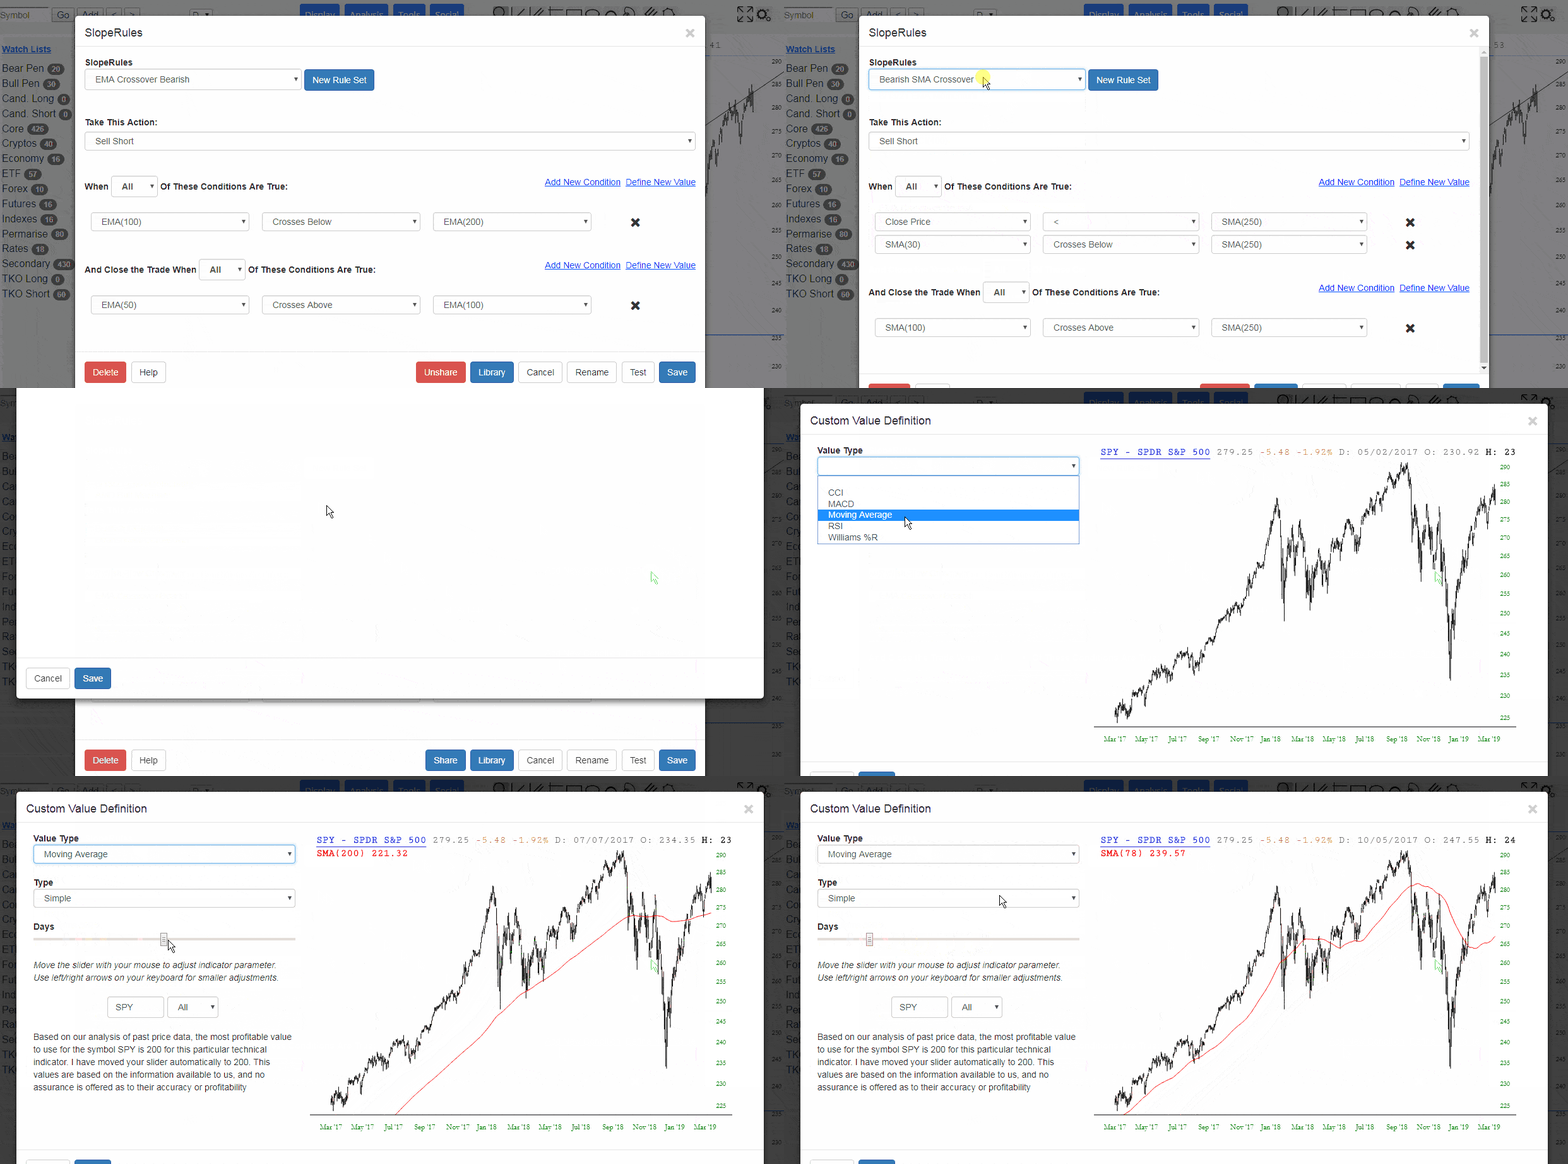
SlopeRules for System Testing
SlopeRules is a feature in SlopeCharts which lets you create a trading system using discrete technical rules for entering and exiting positions. It is deliberately intuitive and simple to use, and closely integrated with the SlopeCharts platform. The array of features is tremendous, and you can learn the details of this product here.

Technical Studies Galore
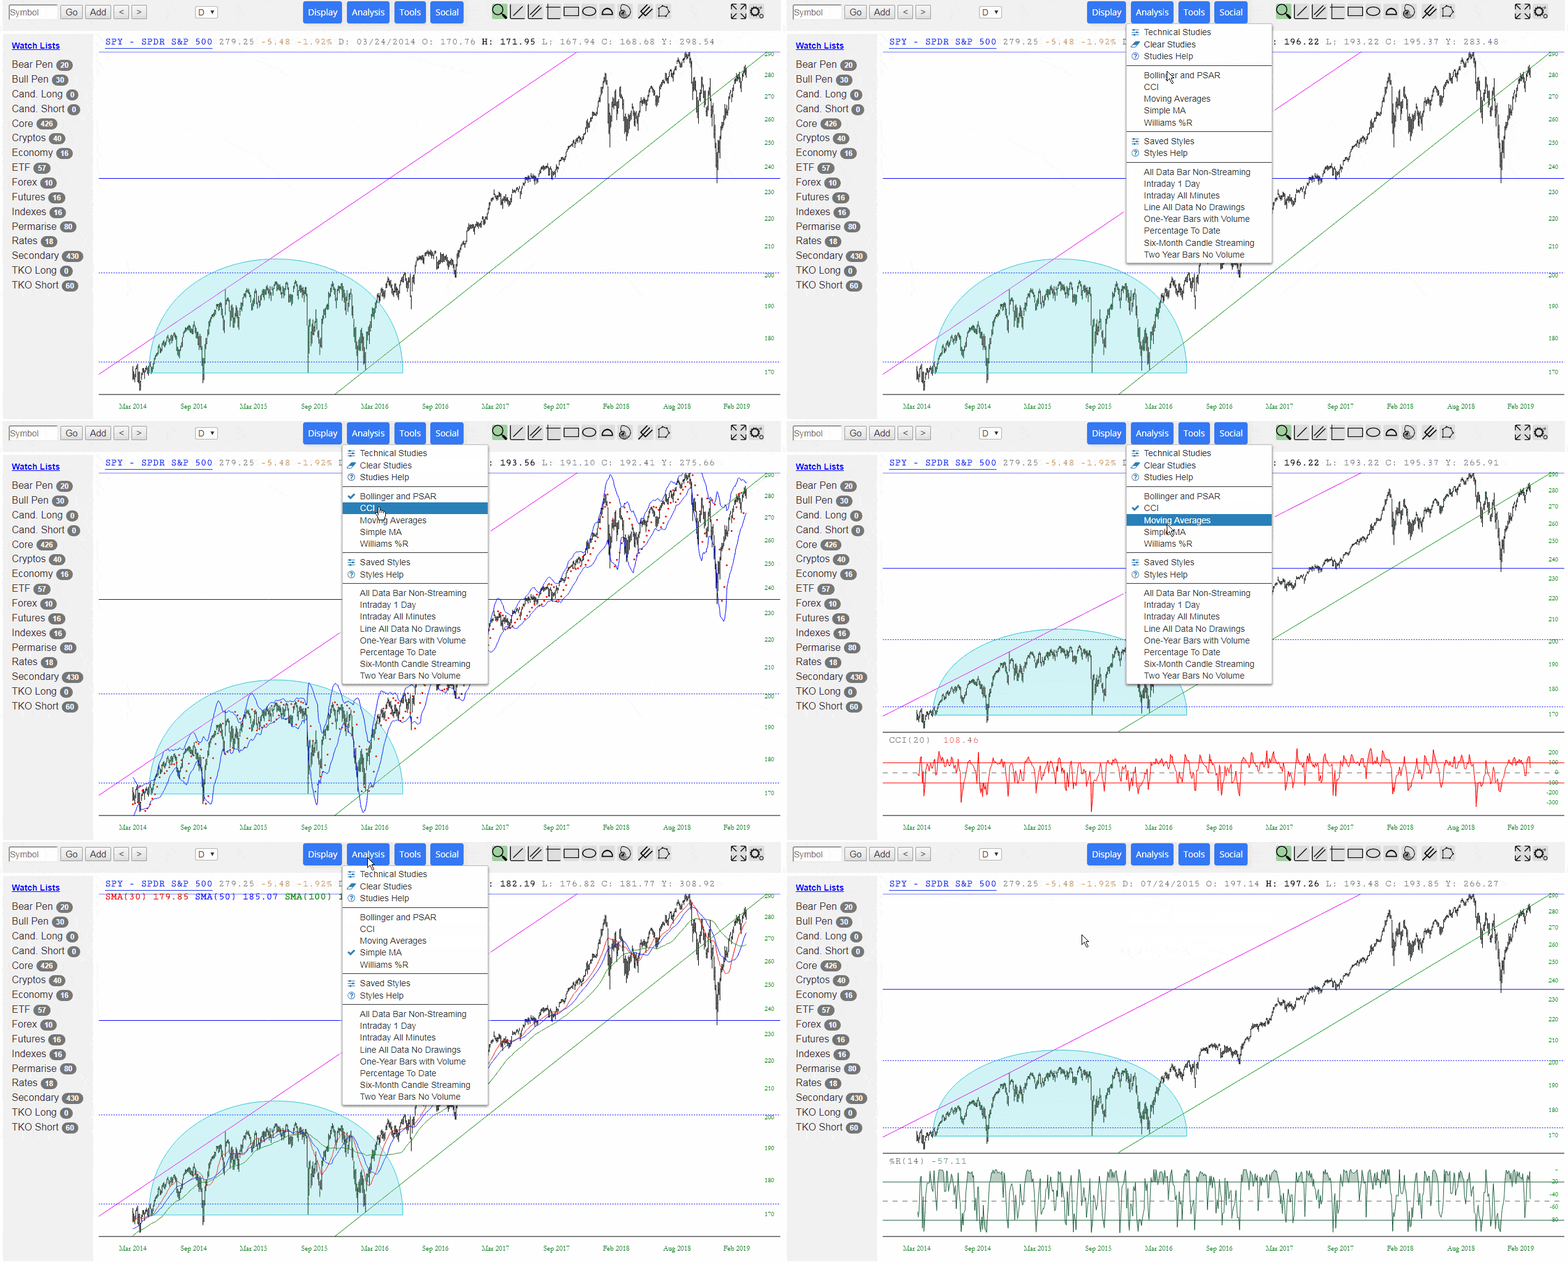
There are a wealth of technical studies (as well as hundreds of thousands of years of historical price data) at your fingertips. Just a few of the studies are:
- Bollinger Bands
- Commodity Channel Index
- Ichimoku Cloud
- MACD
- On Balance Volume
- Parabolic Stop/Reversal
- Rate of Change
- True Strength Index
- Ultimate Oscillator
- Chaikin Oscillator

Sectors Data
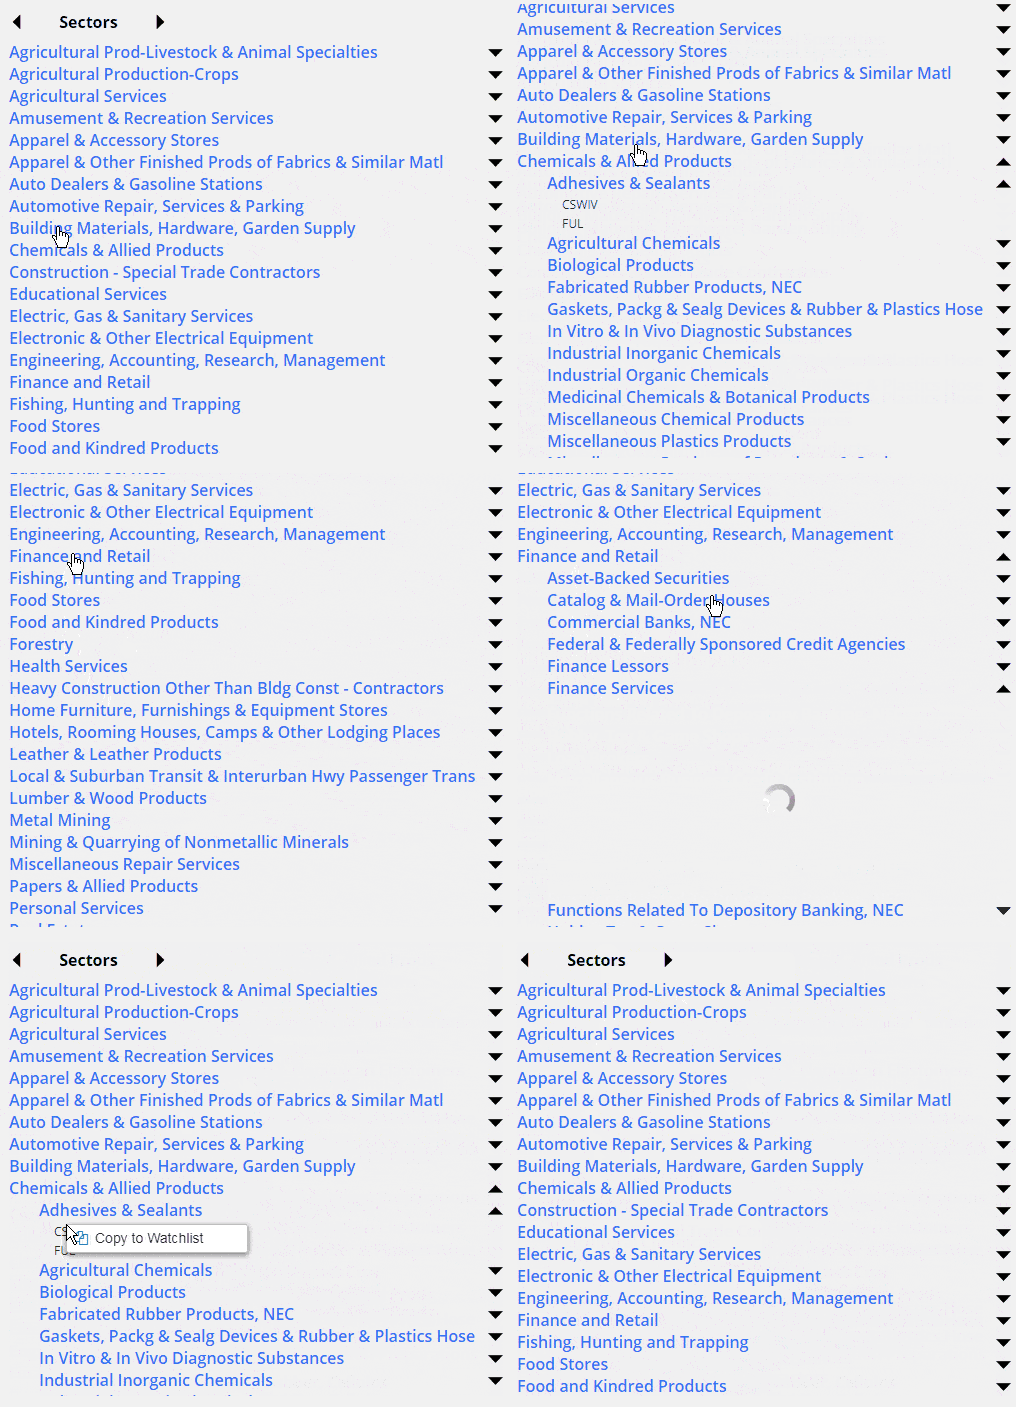
SlopeCharts has access to information about nearly 500 different industry sectors, and you can put this information to work to filter your watch lists based on choosing any sectors you want. For example, you might want to look at all the stocks in the S&P 500 related to retail. You also also examine all the individual stock tickers within each specific sector.


