
Fellow Slopers,
In a post earlier this week (“Shorting Japanese Hockey Stick”), our host noted how Japanese stocks have been going nuts since Abenomics was unleashed (quantitative easing about 4x as large as we’ve had in the US). In this post, we’ll talk a look at the current hedging costs of a handful of the iShares MSCI Japan Index ETF (EWJ) and a handful of US-traded Japanese stocks. First though, I thought I’d share a quick article about one of our host’s favorite companies, Tesla Motors (TSLA).
A Tweet From Elon Musk
Last week, I wrote a quick Seeking Alpha post mentioning that a Bloomberg TV reporter, Cory Johnson, expressed some skepticism about Tesla’s quarter. Johnson has remained bearish on Tesla despite the stock’s recent tear. Curious about Musk’s thoughts on that, I asked him via Twitter. To my surprise, he responded:
@dpinsen People tell me Cory Johnson is a shill for the shorts. Don’t know if true, but he sure behaves that way.
— Elon Musk (@elonmusk) May 12, 2013
I don’t know how many CEOs of publicly traded companies would respond to a question like that via Twitter, but it’s cool that Musk did.
Hedging Costs Of Some US-Traded Japanese Stocks
The US-traded Japanese stocks will look at in this post are these: Sony Corporation (SNE), Honda Motor Company (HMC), Toyota Motor Company (TM), and Internet Initiative Japan, Inc. (IIJI). I picked those as they’re all hedgeable against greater-than-20% drops over the next several months. To illustrate a couple of ways of hedging, we’ll use the Japan Index ETF EWJ. Then we’ll show the costs of hedging the stocks above in the same manner.
Two Ways Of Hedging The iShares MSCI Japan Index ETF
Below are two ways for an investor in the iShares MSCI Japan Index ETF (EWJ) to hedge 1000 shares against a greater-than-20% drop between now and late December.
1) The first way uses optimal puts*; this way allows uncapped upside, but costs a little more. These were the optimal puts, as of Monday’s close, for an investor looking to hedge 1000 shares of EWJ against a greater-than-20% drop between now and December 20th:
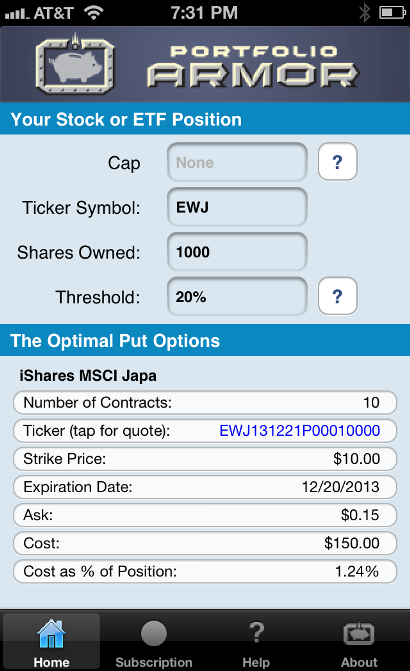
As you can see at the bottom of the screen capture above, the cost of this protection, as a percentage of position value, was 1.24%.
2) An EWJ investor interested in hedging against the same, greater-than-20% decline between now and late December, but also willing to cap his potential upside at 20% over that time frame, could have used the optimal collar** below to hedge instead.
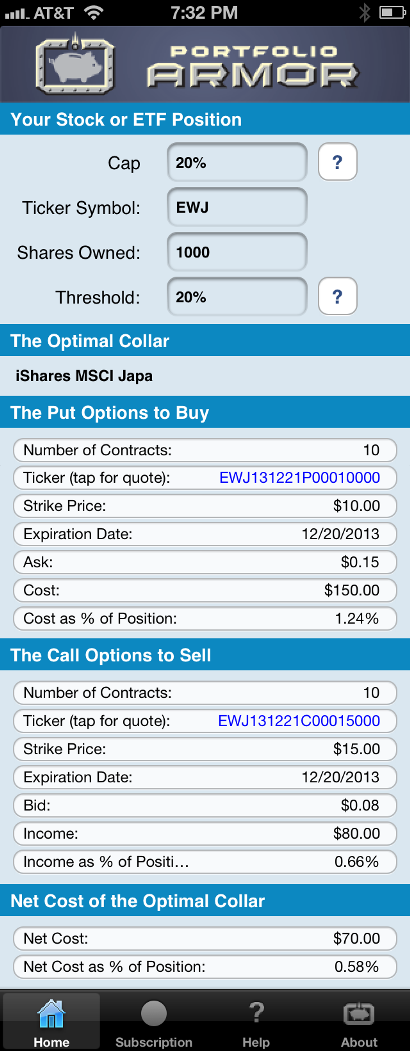
As you can see at the bottom of the screen capture above, the net cost of this collar, as a percentage of position value, was 0.58%.
Note that, to be conservative, the cost of both hedges was calculated using the ask price for the optimal puts and the put leg of the optimal collar, and the bid price of the call leg of the optimal collar; in practice, an investor can often buy puts for some price less than the ask price (i.e., some price between the bid and ask) and sell calls for some price higher than the bid price (i.e., some price between the bid and the ask).
Possibly More Protection Than Promised
In some cases, hedges such as the ones above can provide more protection than promised. For a recent example of that, see this post about hedging the SPDR Gold Trust ETF (GLD).
Hedging Costs For All Of The Names Mentioned Above
The table below shows the costs, as of Friday’s close, of hedging all of the stocks mentioned above in a similar manner as WFT: first, with optimal puts against a >20% drop over the next several months; then, with optimal collars against the same percentage drop over the same time frame, while capping the potential upside at 20%. The SPDR S&P 500 ETF (SPY) was added to the table for comparison purposes.
| Name | Symbol | Optimal Put Hedging Cost | Optimal Collar Hedging Cost |
| Sony Corp. | SNE | 5.56% | 0.98% |
| Honda Motor | HMC | 2.17% | 1.81% |
| Toyota Motor | TM | 1.14% | 0.44% |
| Internet I Japan | IIJI | 10.4% | 7.89% |
| MSCI Japan | EWJ | 1.24% | 0.58% |
*Optimal puts are the ones that will give you the level of protection you want at the lowest possible cost. Portfolio Armor uses an algorithm developed by a finance PhD to sort through and analyze all of the available puts for your stocks and ETFs, scanning for the optimal ones.
**Optimal collars are the ones that will give you the level of protection you want at the lowest net cost, while not limiting your potential upside by more than you specify. The algorithm to scan for optimal collars was developed in conjunction with a post-doctoral fellow in the financial engineering department at Princeton University. The screen captures of optimal hedges above come from the Portfolio Armor iOS app.
