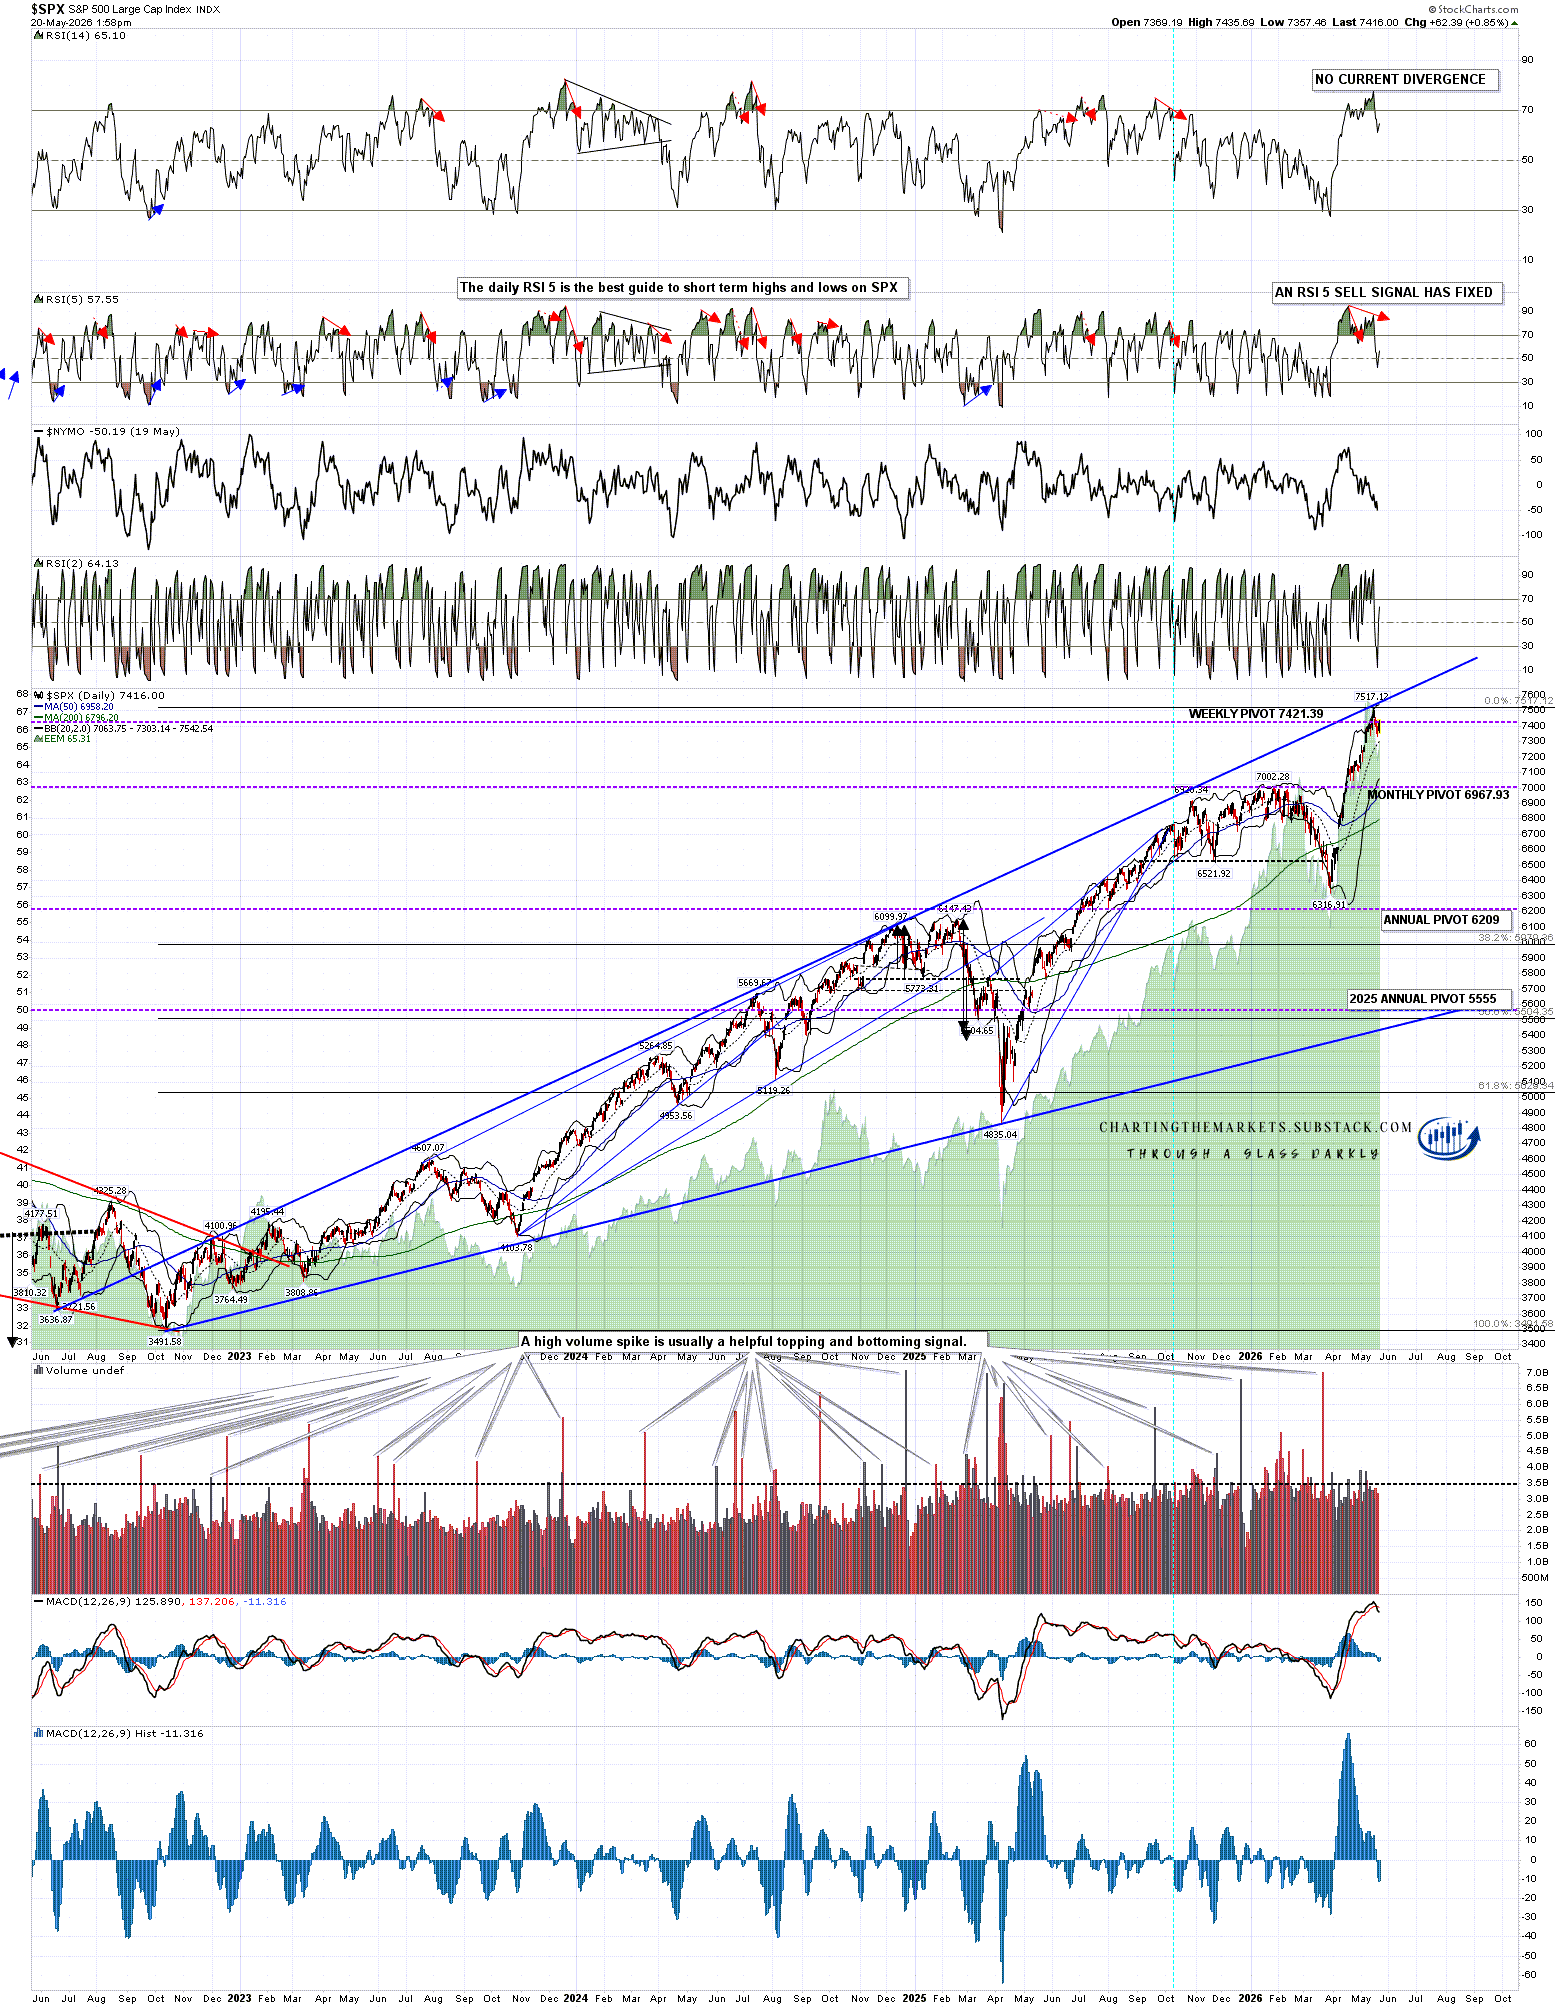
In my post on Wednesday I was looking at the H&S patterns that had broken down on SPX, QQQ and DIA and saying that, for a variety of reasons I explained then, I didn’t think any of those H&S patterns were likely to reach their targets, and would likely instead fail into retests of their all time highs. Since then we have seen the start of rally I expected and equity indices have reached another inflection point where they can either break up towards retests of the all time highs, or fail down into those H&S targets.
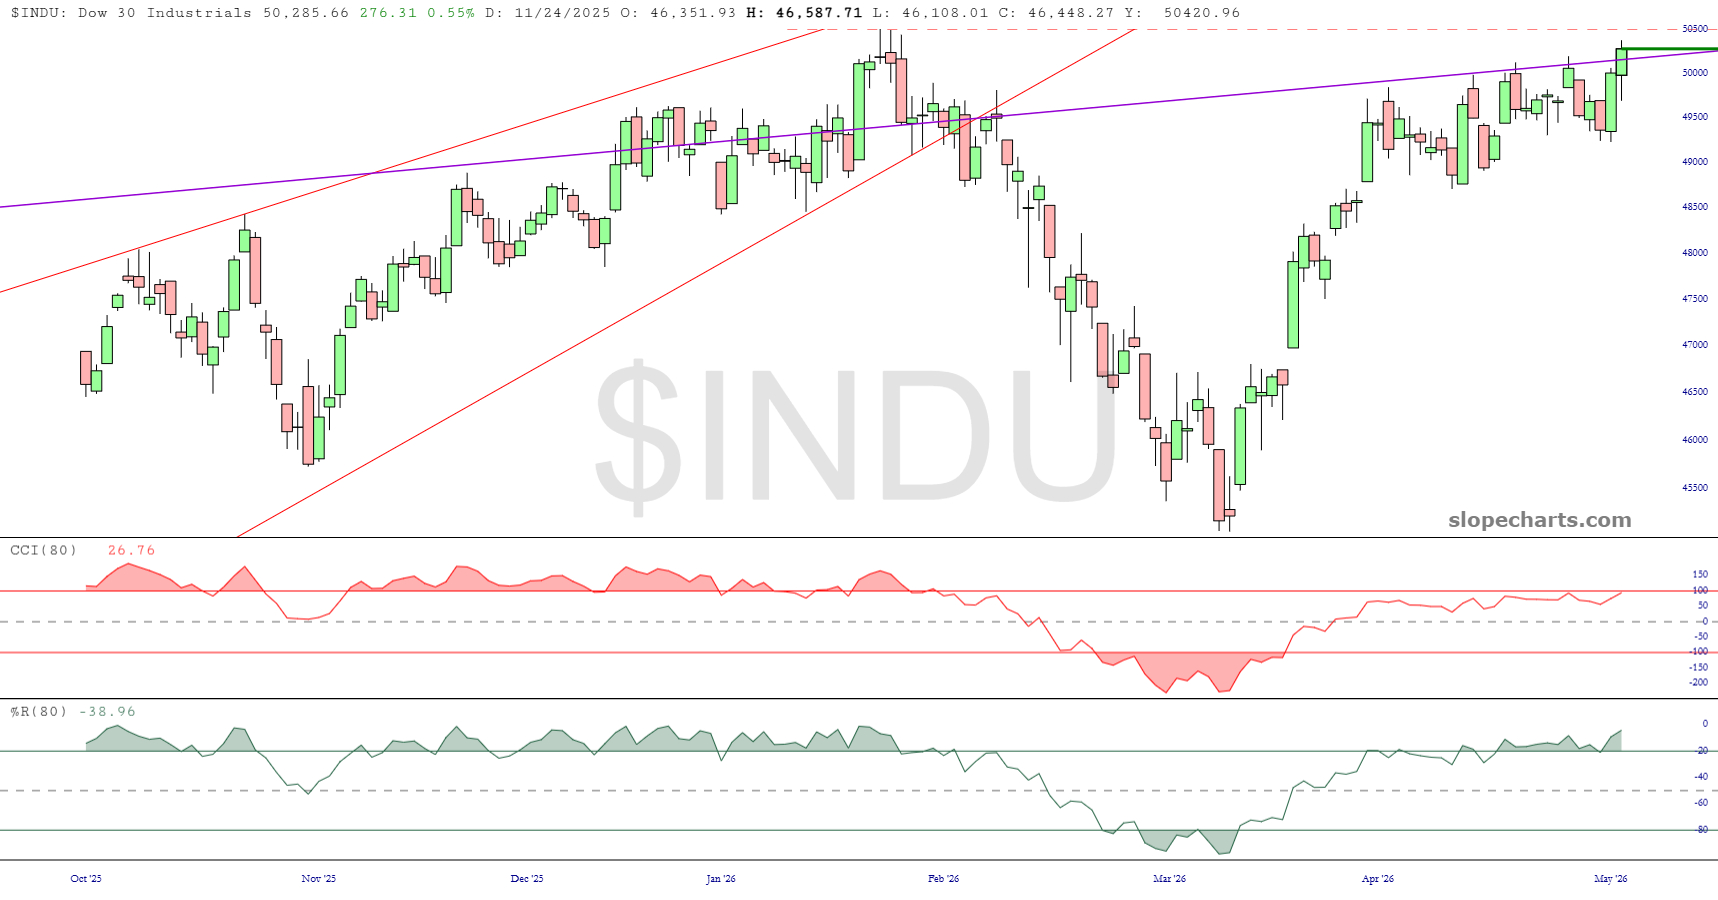
On DIA the H&S failed this morning on the break back over the H&S right shoulder, and that now has a target at a retest of the all time high, but the big dogs here are SPX and QQQ, so I’ll mainly be looking at those today.
(more…)