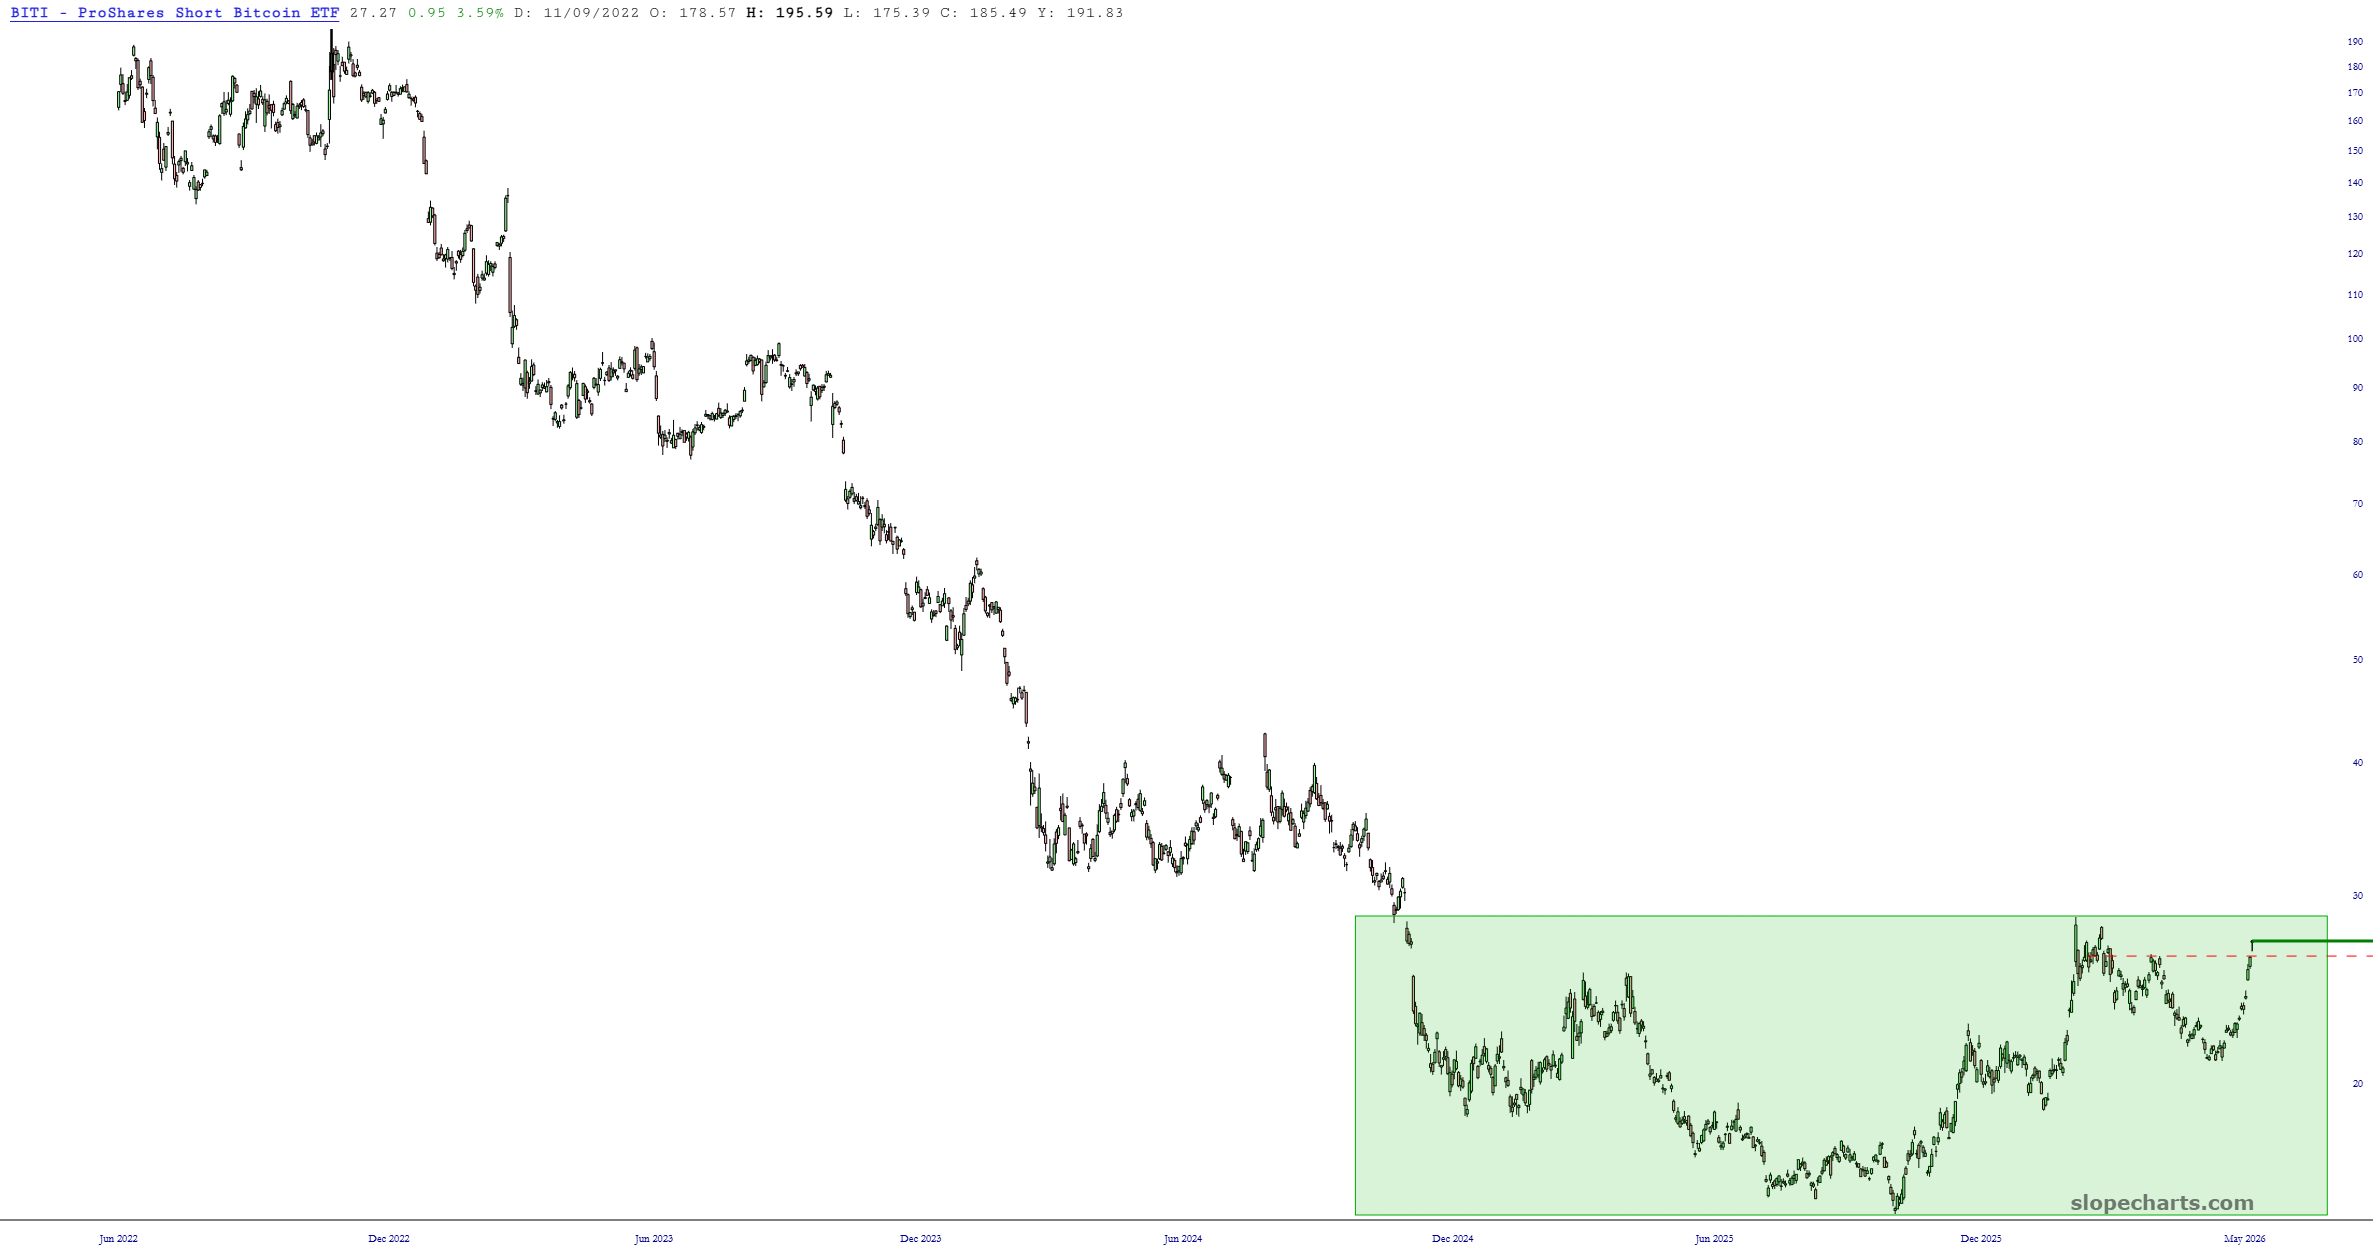
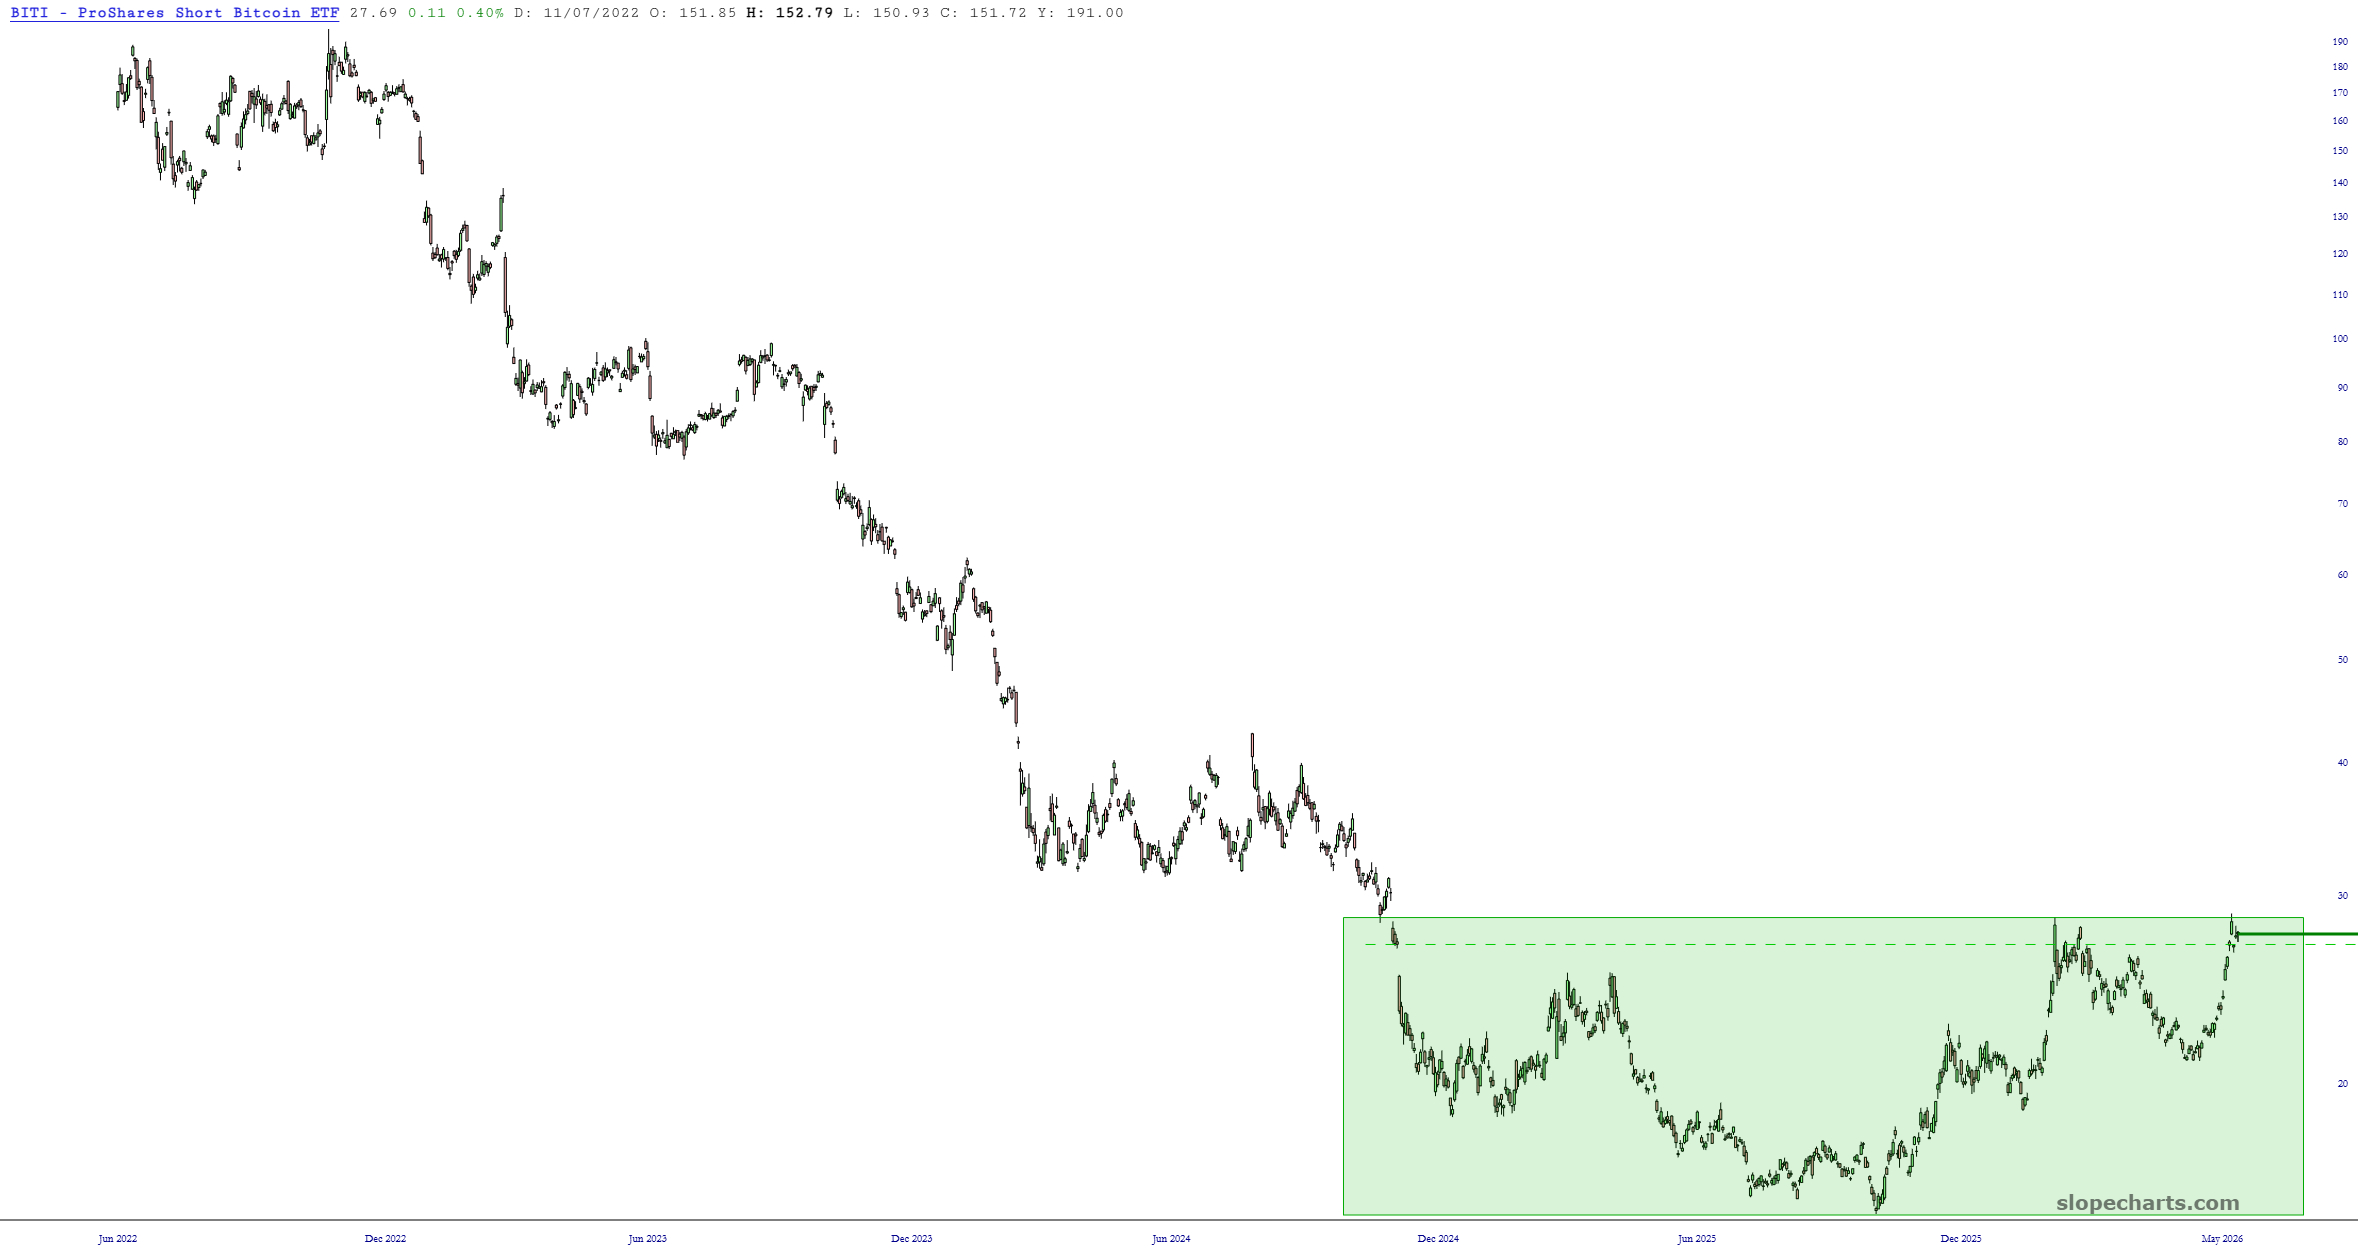
I’ll just say again, the bearish-on-Bitcoin fund BITI is looking like a potentially amazing inverted head and shoulders bullish bottom.
Slope initially began as a blog, so this is where most of the website’s content resides. Here we have tens of thousands of posts dating back over a decade. These are listed in reverse chronological order. Click on any category icon below to see posts tagged with that particular subject, or click on a word in the category cloud on the right side of the screen for more specific choices.
I’ll just say again, the bearish-on-Bitcoin fund BITI is looking like a potentially amazing inverted head and shoulders bullish bottom.
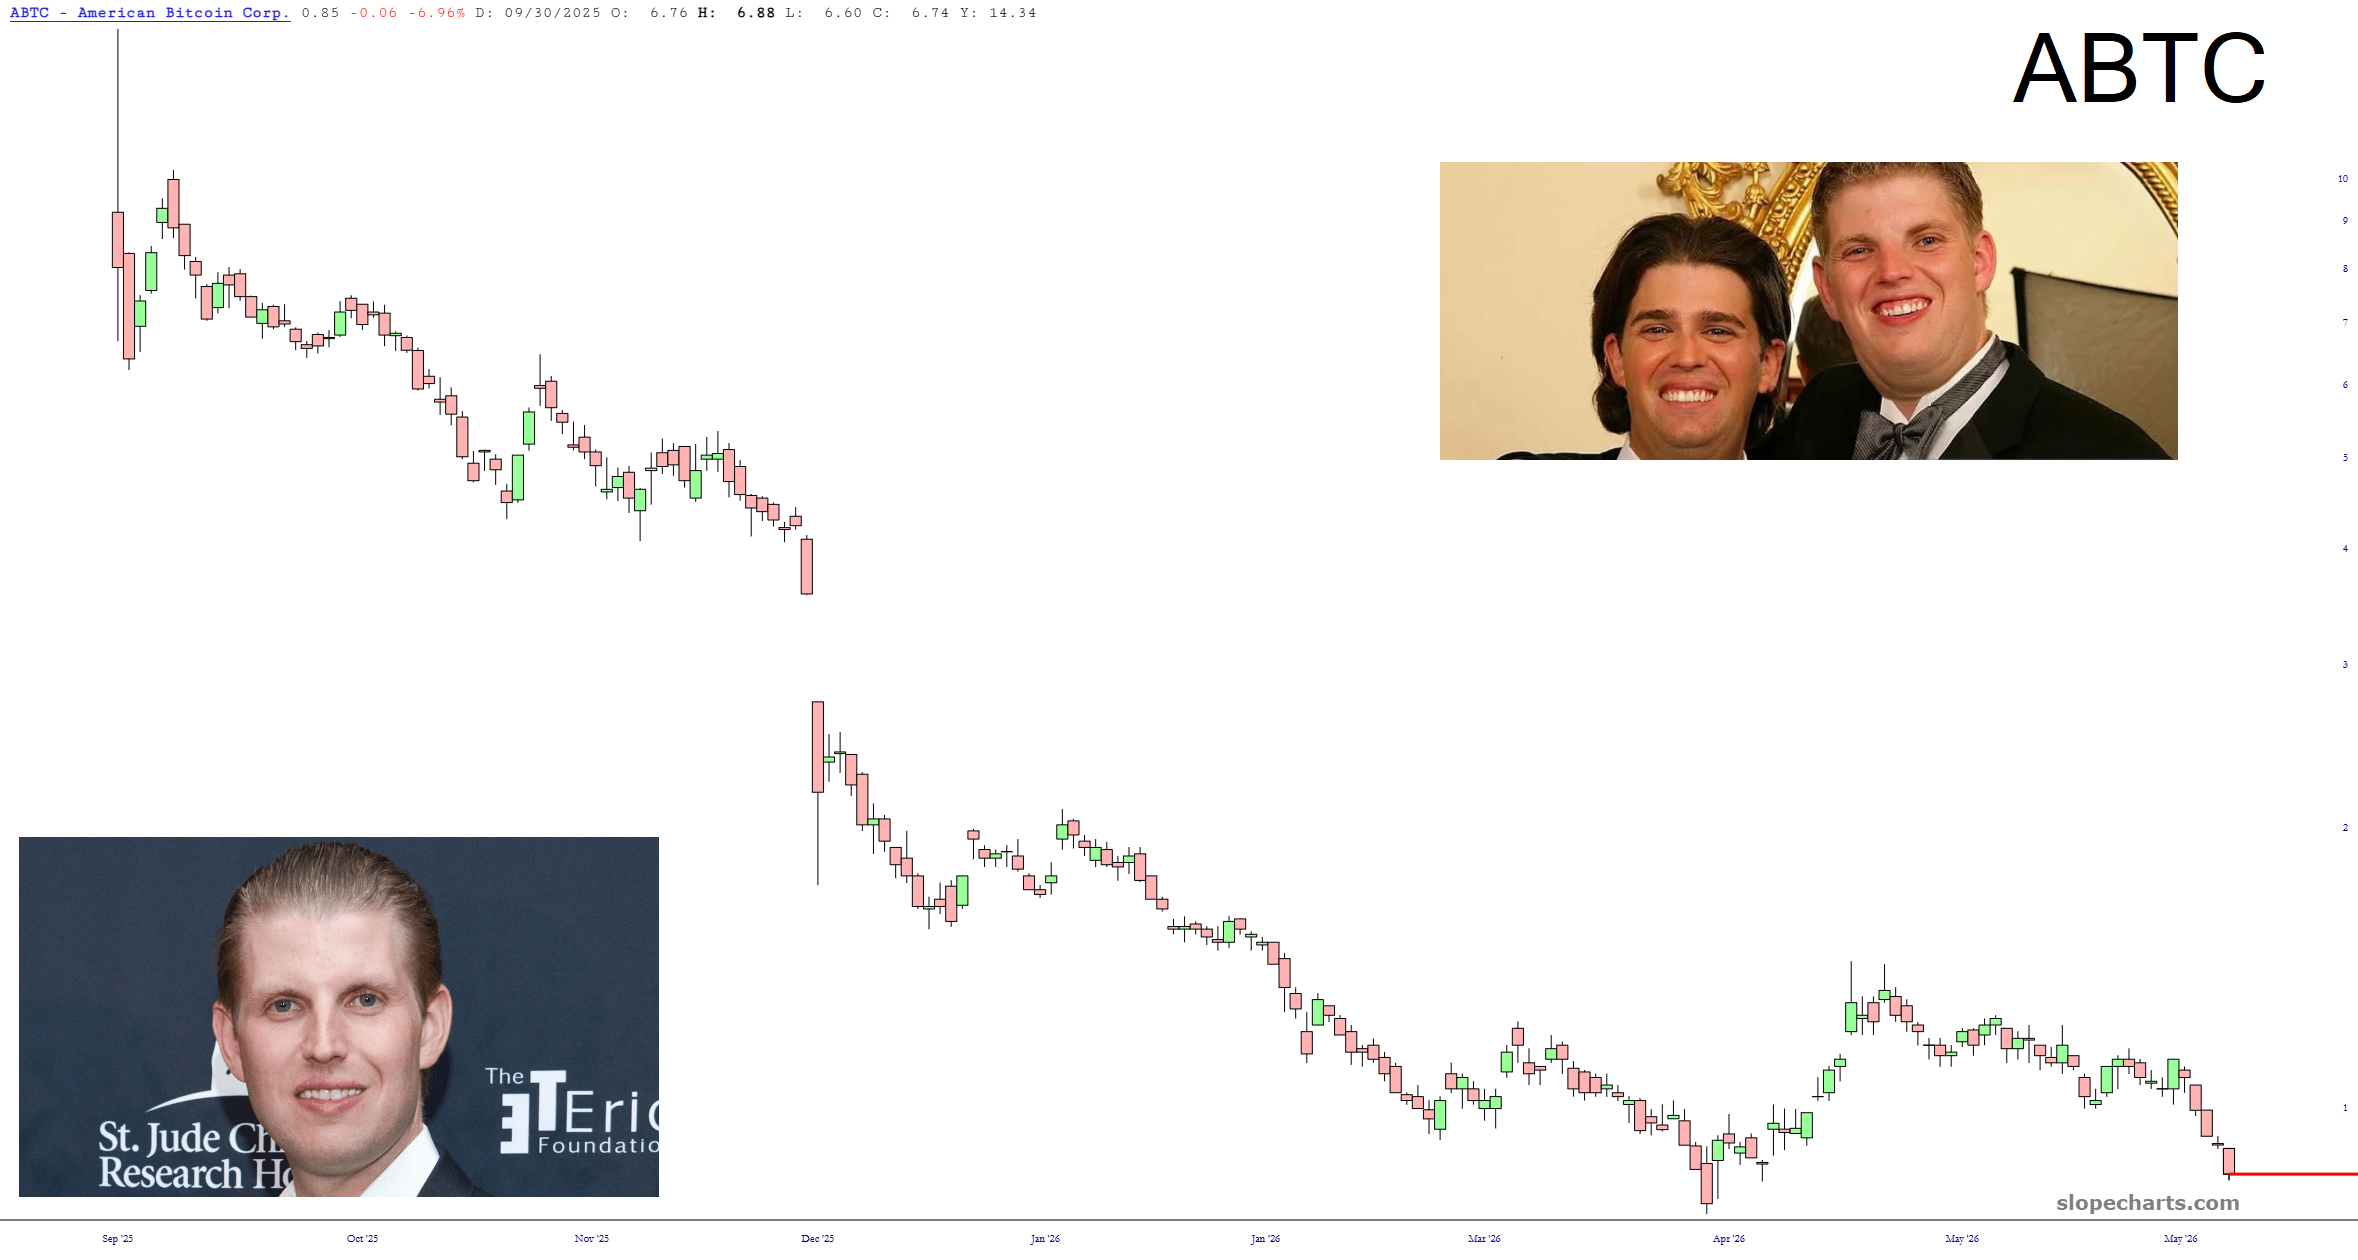
This is serious a new low for stupid shit, even for a crypto creep.
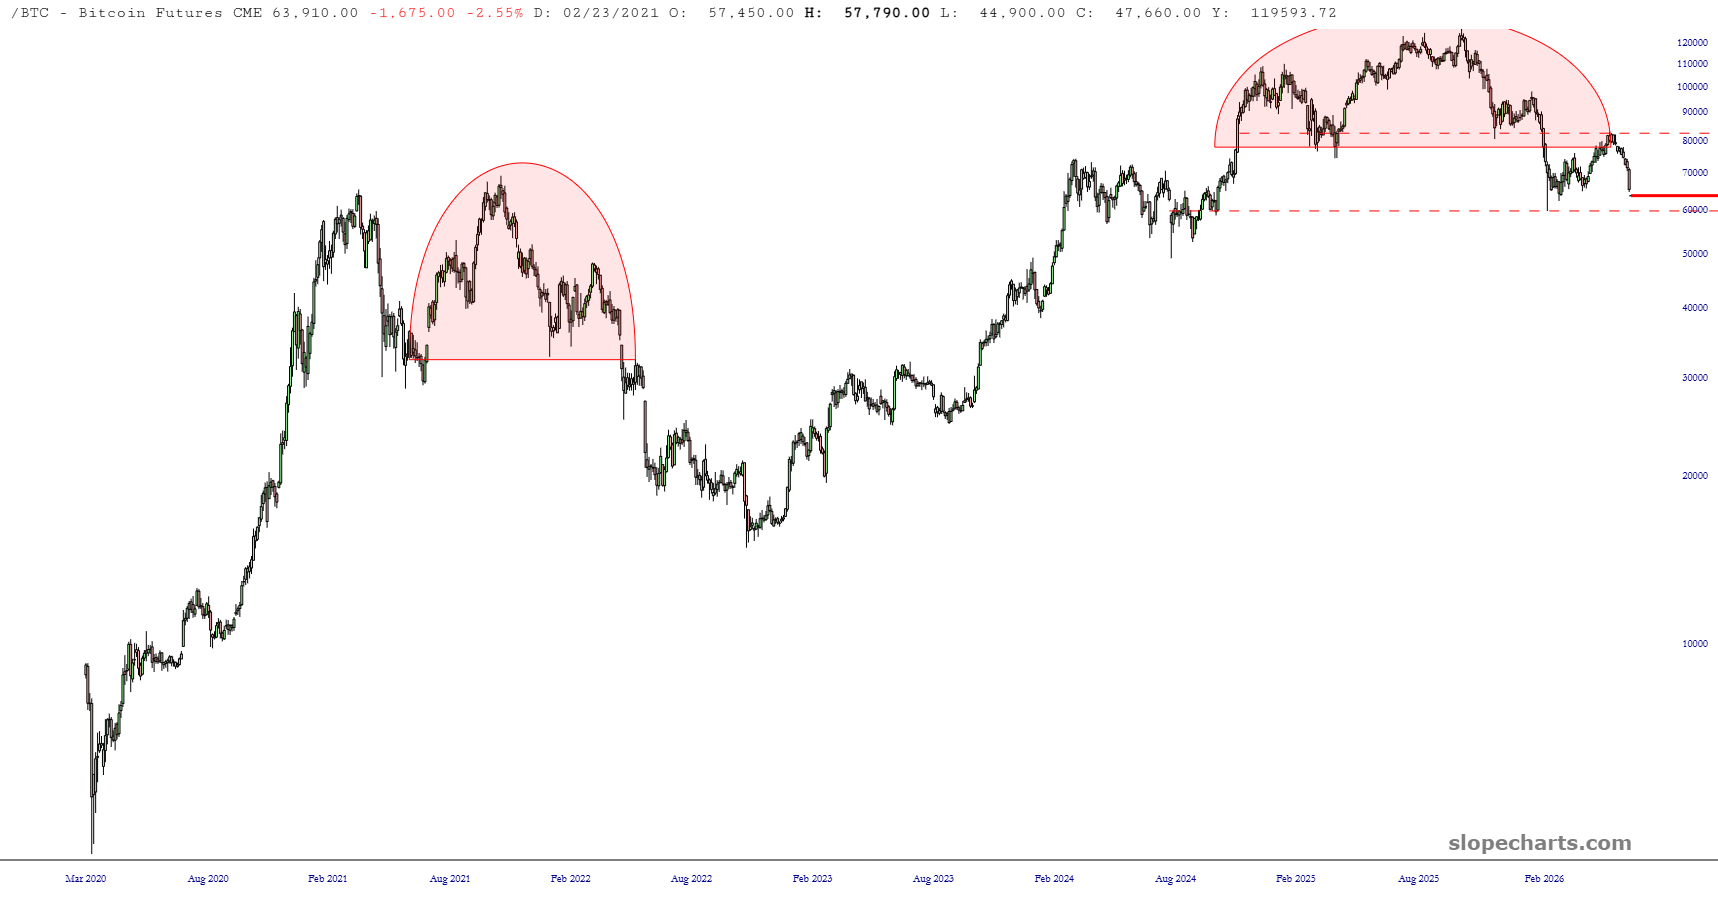
Thumbing through charts on Thursday evening, I was once again struck by the awesomeness of the Bitcoin top. This sucker could be headed for almost total destruction.
No, this isn’t another Oprah post. I’m talking about BITI, the inverse-on-BTC ETF which has hammered out what is looking like a sensational inverted H&S bottom. It isn’t quite complete, but if it crosses above $29, that suggests a measured move of about $43.