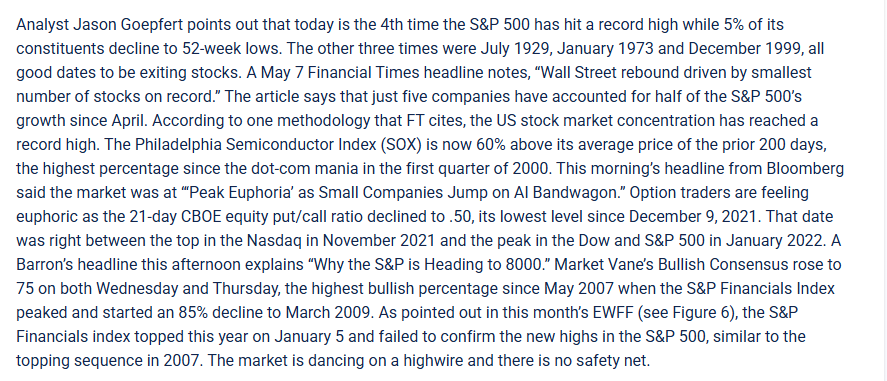
Our friends in Gainesville have an interesting summary tonight as to the mania that has gripped the public, late 1999 style. Kindly read (and click for a larger, more readable version):
Slope initially began as a blog, so this is where most of the website’s content resides. Here we have tens of thousands of posts dating back over a decade. These are listed in reverse chronological order. Click on any category icon below to see posts tagged with that particular subject, or click on a word in the category cloud on the right side of the screen for more specific choices.
Our friends in Gainesville have an interesting summary tonight as to the mania that has gripped the public, late 1999 style. Kindly read (and click for a larger, more readable version):
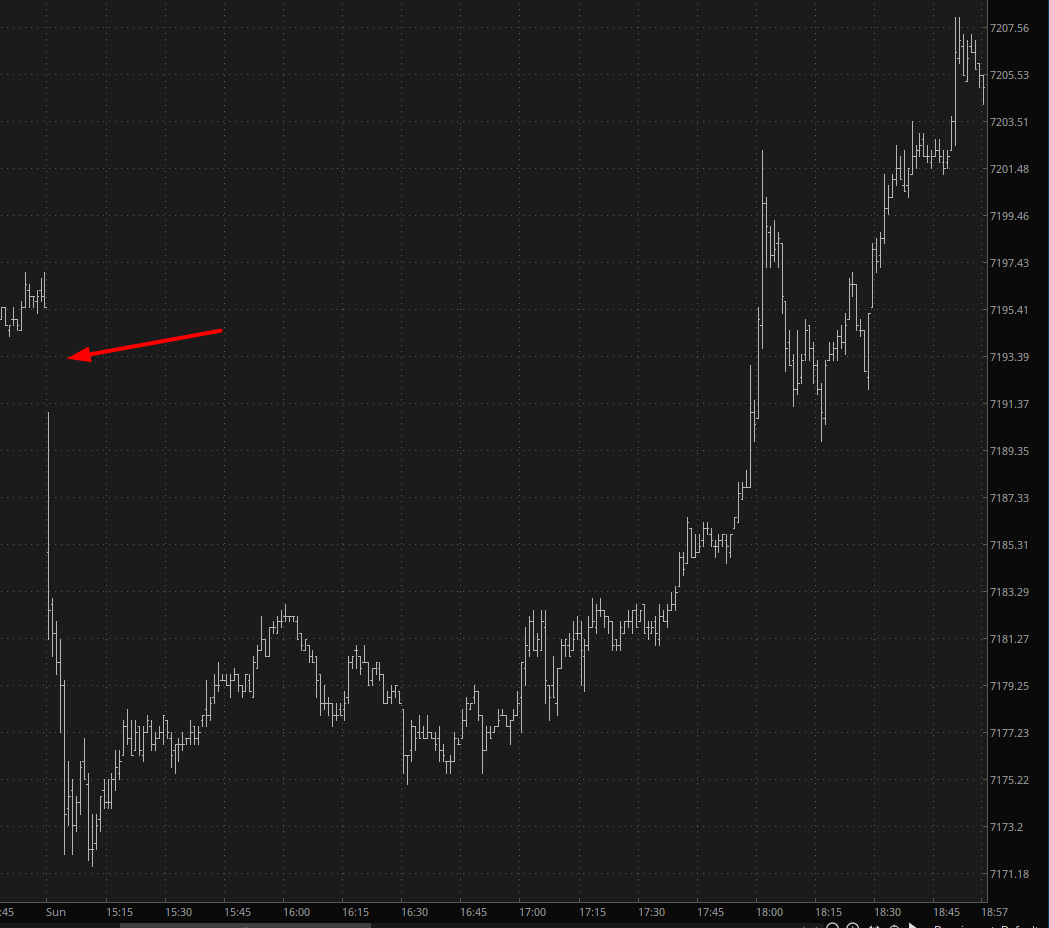
Heading into the weekend, it seemed the big question was how peace talks would go. By Saturday, it was clear that they weren’t even going to take place, which in saner times would have meant a total wipe-out on Monday (that is to say, today).
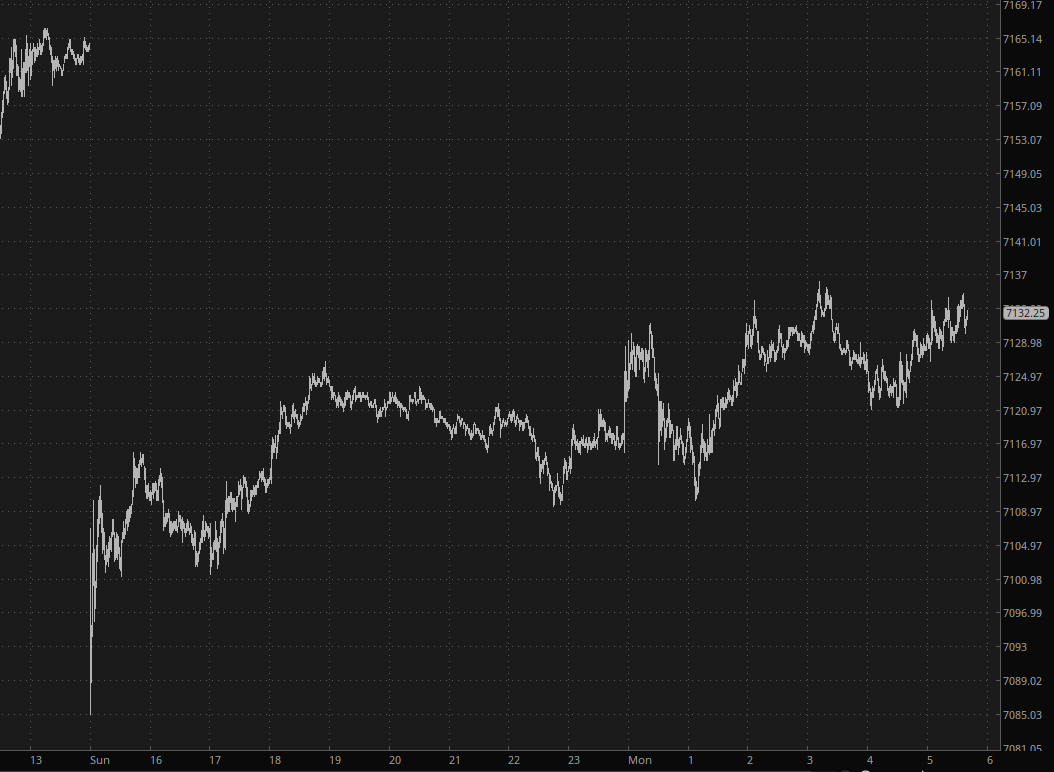
In fairness, there WAS a gap down on Sunday when the futures opened, albeit a modest one, and even then, the market bottomed within minutes before dusting itself off and moving to LIFETIME HIGHS on the /ES, the /NQ, the /RTY, and any other index you might care to mention.
Hey, I guess I should be grateful everything isn’t raging green to new highs, right? Not yet at least.
In the least surprising event since someone released a hammer and it fell to the ground, equity futures erased the majority of their Sunday shock drop. On the heels of the mega-rally of the past few weeks, the news over the weekend would normally have crashed equities, but as I stand here before the opening bell, futures are down about half a percent or so. The universal ticker symbol is now BFD.
So, I know I have my bias. Controlling that bias is what ensures I stay solvent and profitable. But in trading nobody gets rid of their bias, they merely control it. I can go long or short and enjoy the profits and handle the losses just fine. I prefer bear markets because I am simply more comfortable trading them, the profits come more easily for me personally, and the world makes a little more sense to me. When we are in the midst of bull markets, I admit I am just not comfortable.
I have learned to trade them a bit better, but at my core I feel like bull markets tend to benefit the masses for ineptness. Now before anyone gets in a tizzy, I’m not trying to say, “All bulls this” and “All bears that”. What I mean is that bear markets, in my perspective, tend to separate the kids from the adults, so to speak. When in the midst of a market storm, there are those who know how to play, those who know they don’t do well and stand on the sidelines, and then those who get smashed to bits. Bear markets feel like a rite of passage. If you can survive them, then you can survive anything.
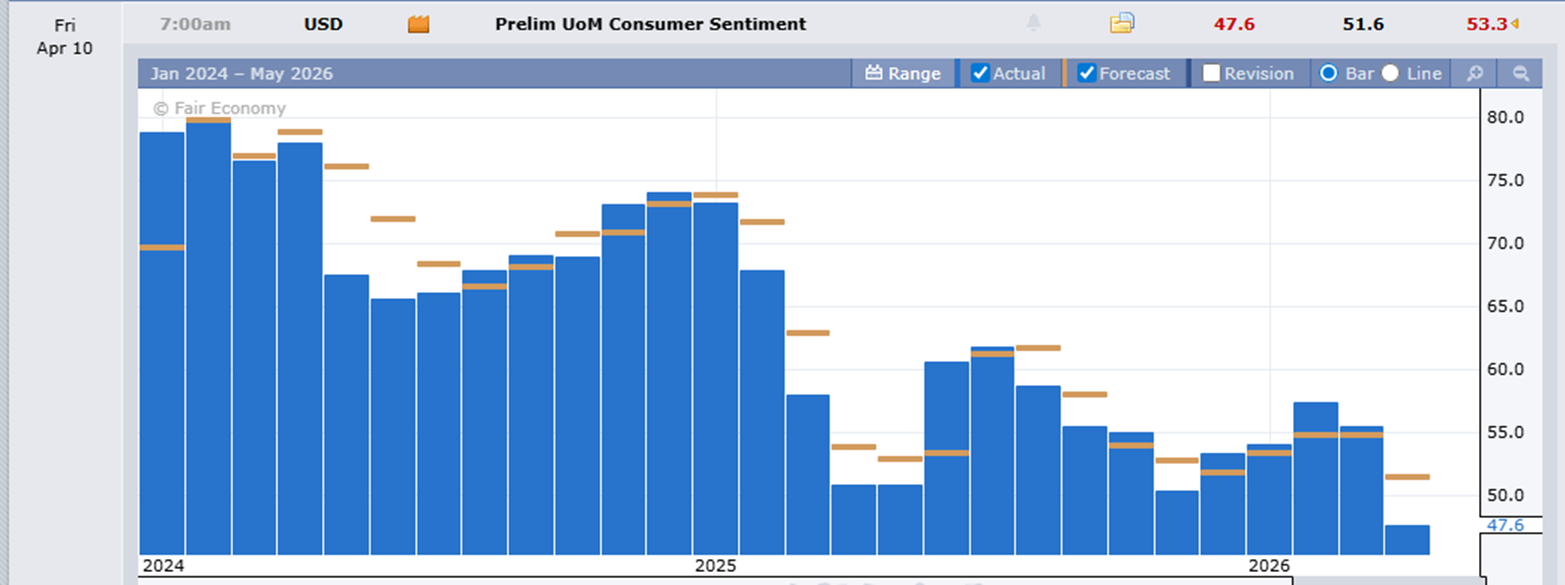
(more…)One economic data point that came out recently which I didn’t notice was the Michigan Consumer Sentiment report. It’s actually kind of a big deal. The expectation was 51.6, and the actual number came in at 47.6: