
So, I know I have my bias. Controlling that bias is what ensures I stay solvent and profitable. But in trading nobody gets rid of their bias, they merely control it. I can go long or short and enjoy the profits and handle the losses just fine. I prefer bear markets because I am simply more comfortable trading them, the profits come more easily for me personally, and the world makes a little more sense to me. When we are in the midst of bull markets, I admit I am just not comfortable.
I have learned to trade them a bit better, but at my core I feel like bull markets tend to benefit the masses for ineptness. Now before anyone gets in a tizzy, I’m not trying to say, “All bulls this” and “All bears that”. What I mean is that bear markets, in my perspective, tend to separate the kids from the adults, so to speak. When in the midst of a market storm, there are those who know how to play, those who know they don’t do well and stand on the sidelines, and then those who get smashed to bits. Bear markets feel like a rite of passage. If you can survive them, then you can survive anything.
I was going to write more here on my tendencies, my thoughts on bull markets, etc., but it sounded more like complaining that anything useful, so I’m moving ahead with something I’ve noticed, something I’ve complained about in the past, and it’s something I don’t fully understand, but I do know some of the implication and it’s not good.
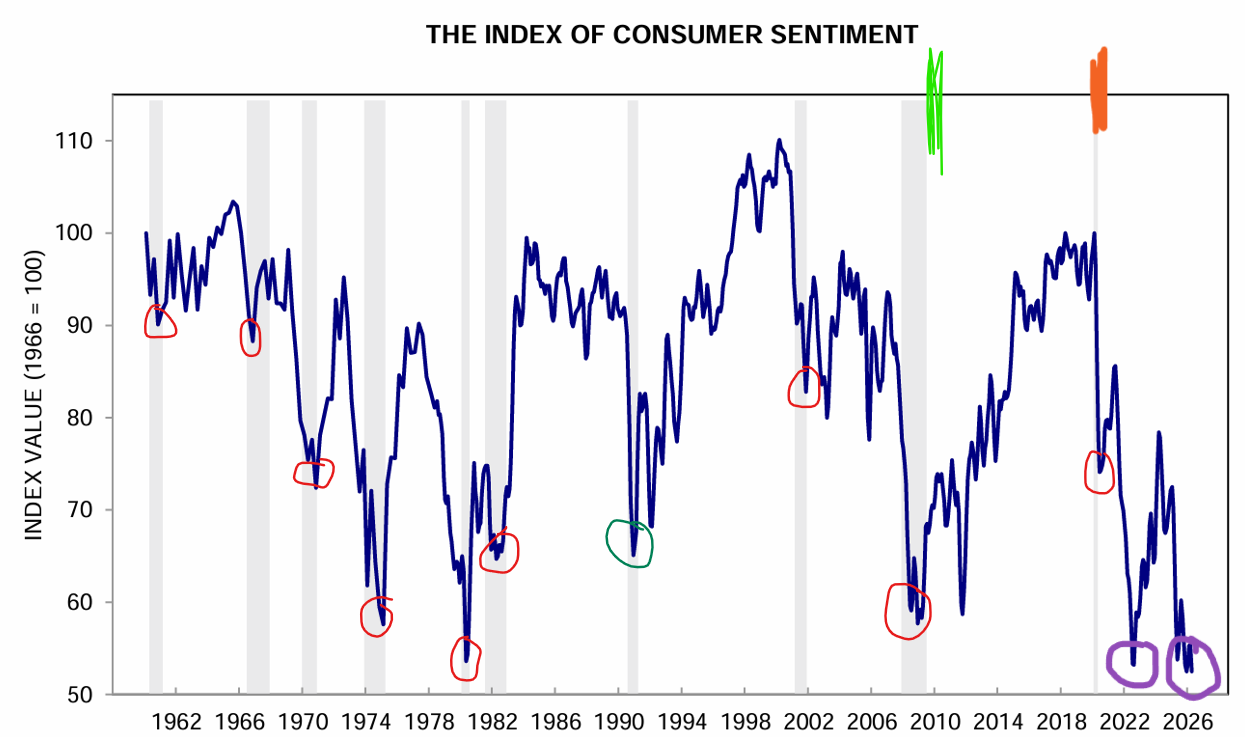
I copied this from a post that Tim provided on April 13. It’s a chart showing consumer sentiment with gray areas highlighting recessions. I made a few markings on this that I want to point out. First, the red circles seem to be following those recessionary sections, which, at the time, also coincided with market bottoms. These were logical in hindsight in that stocks are essentially supposed to be a leading indicator.
When the future is bright, regardless of what is occurring at the time, stocks go up even if sentiment is down in the dumps. On the flip side, if things start to break in stocks and sentiment is high, stocks will turn down despite the sentiment being sky high. There was an ebb and flow to the sentiment that coincided with broad market movements. Everything up to the green marked section (2010) followed this pattern. I’ll focus on this first, then I’ll explain the difference after that time.
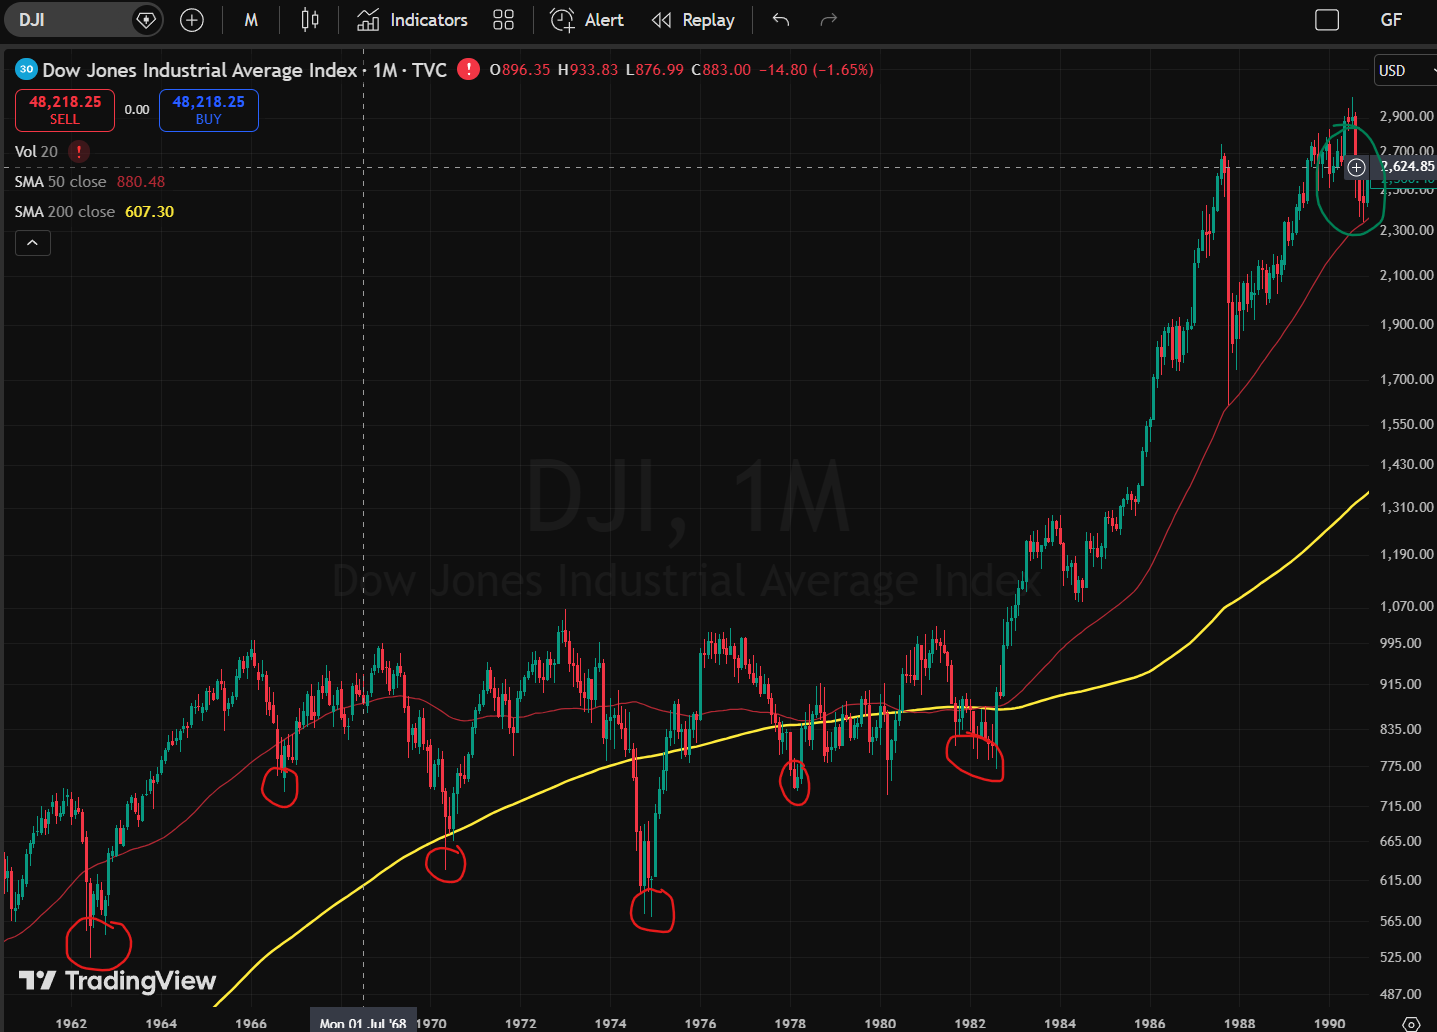
The Dow Jones Industrial Average shows very easily how the sentiment reacted to market movements, showing how aligned investment was with the overall economy. The sentiment came out of a deep measure in 1962 following stocks for a few years. Then markets turned down, followed by sentiment yet again in 1966. And so on and so forth for all the circled areas. Note, the circled green section was an anomaly in sentiment that did not coincide with a market downturn (or at least not a very deep one). Anyway, this all made sense. Stocks up, money up, good times, high sentiment. Stocks down, money down, sentiment down. And down and up we go.
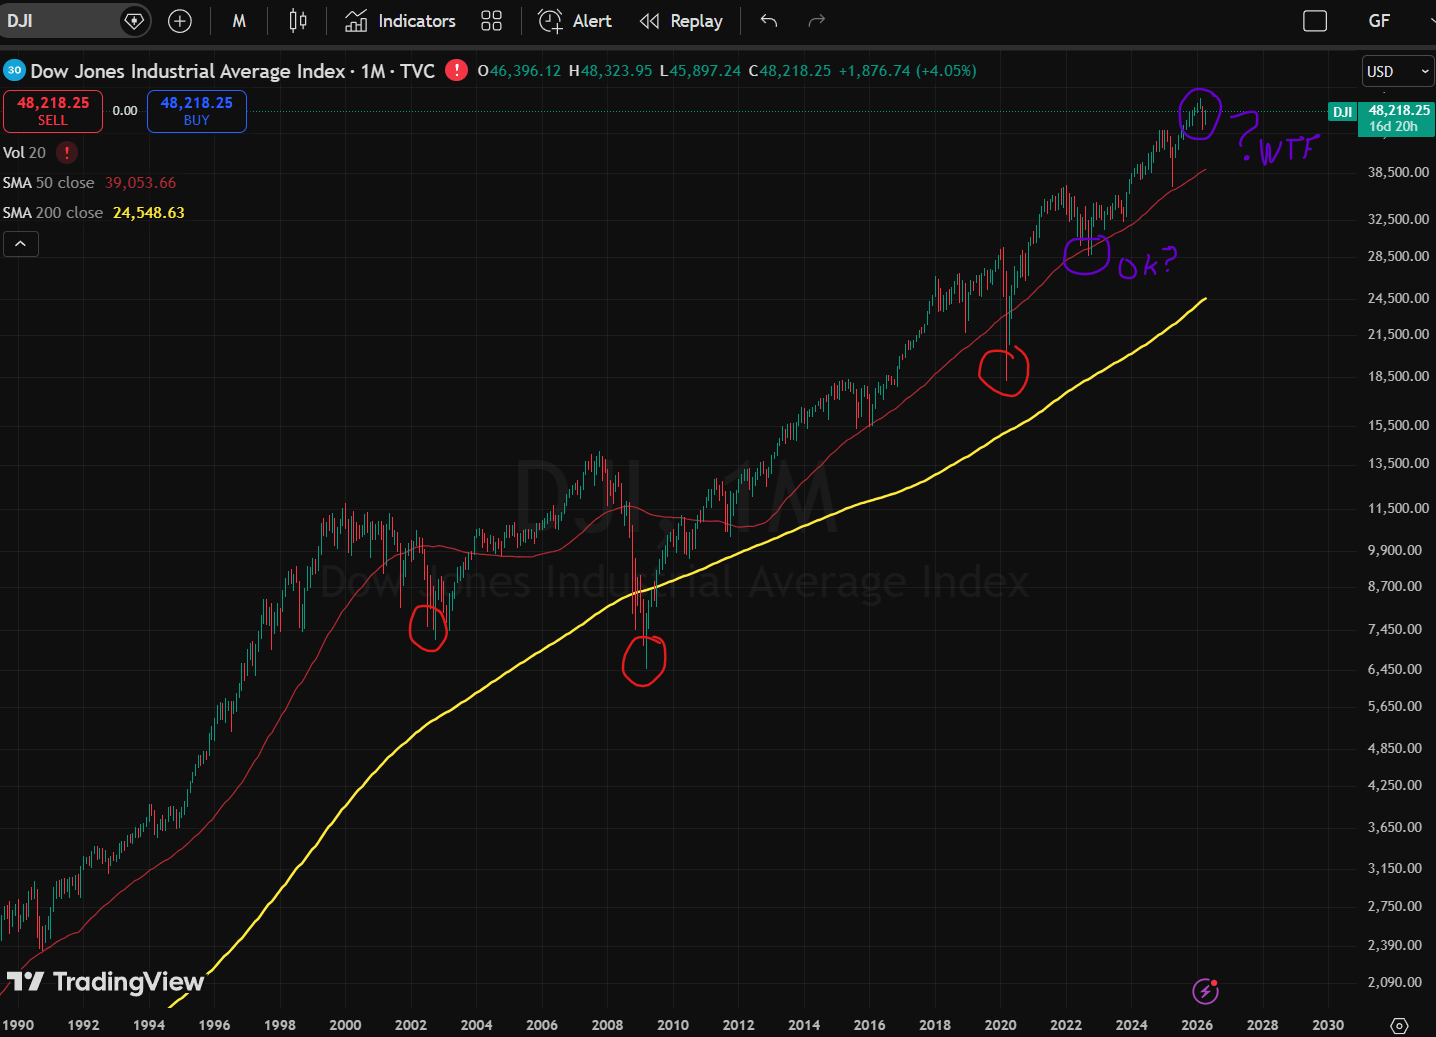
The next two circled areas are in more recent history that some may remember. The first was the 2001 bear market following the 90’s bull. As with previous bear markets, sentiment followed. Then the 2008 financial crisis is next and shows the same familiar pattern. Here, at the 2010 green section to the orange section (2020), this would be the last time things made any sort of sense. Sentiment increased, as did stocks during this time. A lot of that was due to tremendous money printing. We had a few wobbles along the way, until we got to 2020. That year shows a sentiment dip that followed a tremendous fall in stocks.
The sentiment shift should be no surprise. However, sentiment had a miniscule recover, meaning things still felt shitty, despite stocks going on a run that literally doubled during the same timeframe. The next relatively tiny dip in stocks occurred in the 2022 bear market. This bear market was tame compared to the last two and yet sentiment dropped to levels not seen before (or at least not before what is shown in the sentiment chart). We’ve again had a bounce in sentiment that coincided with this shallow bear market. But sentiment has all but collapsed back to those all-time low levels. And this time, we are literally less than 2% from market all-time highs. There is no “bounce” to be had in stocks.
This is all scary for a few reasons. First, there were times in the past sentiment chart where local sentiment dips occurred while stocks just kept on stepping up. But those were shallow sentiment drops which seemed to simply correct once stocks got into a groove. This most recent sentiment drop means that things feel shitty all around, and stocks simply don’t care. So, if stocks truly want to keep marching higher from here, then this sentiment “dip” is possibly a new norm. And things are going to get a whole lot shittier.
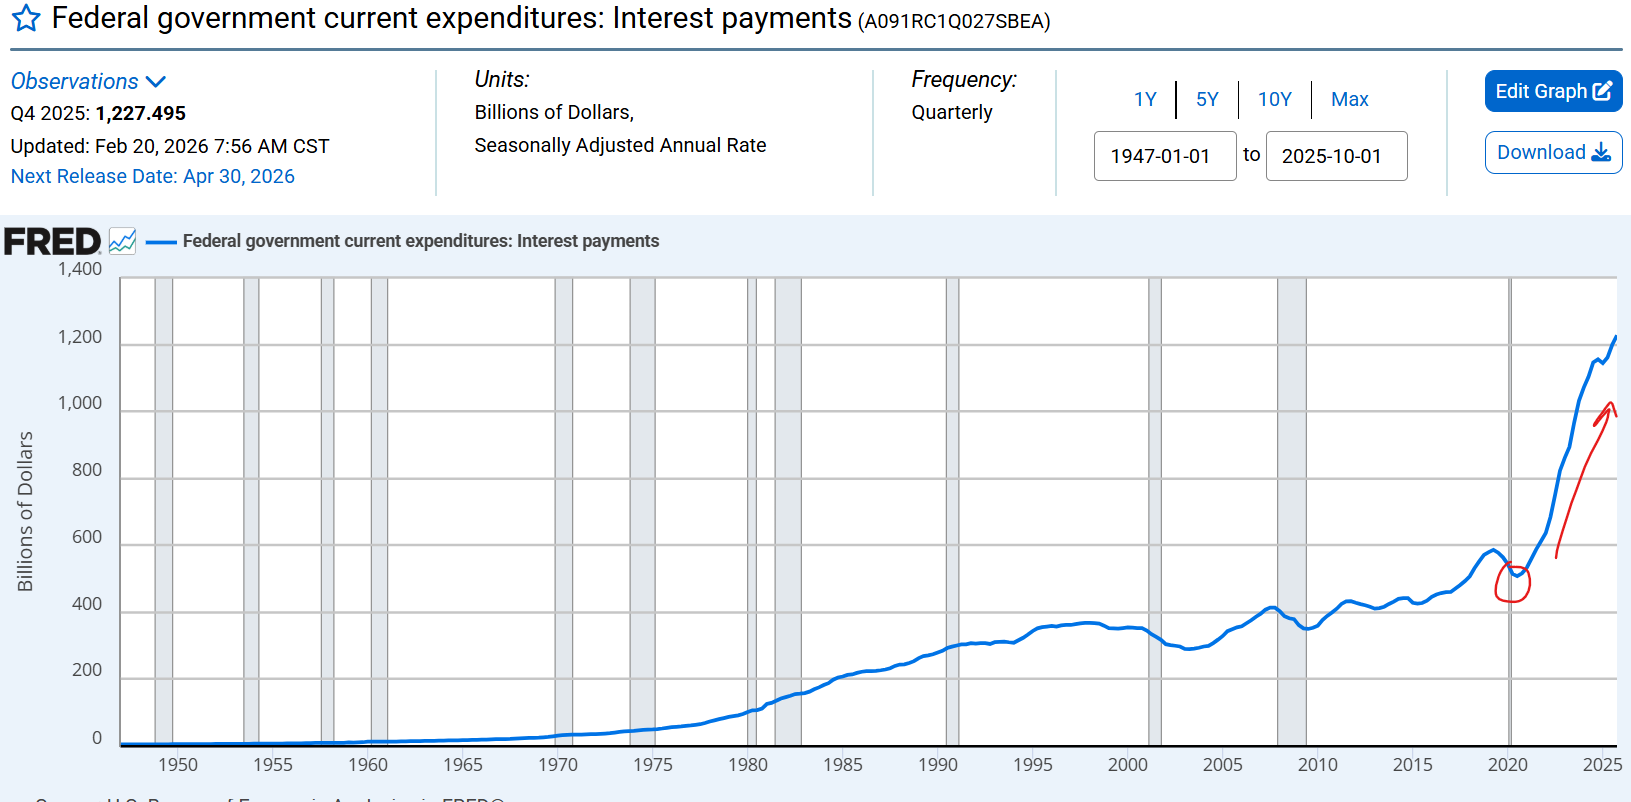
I’m going to finish with this chart because I think this is the real culprit. The debt level and interest payments are nothing new. They’ve been a specter over our heads for years. But the speed at which this has increased since 2020 I think is finally catching up to us. I think the warnings from some famous economists is being ignored at our own peril and the party wants to keep going.
So, bringing this all back to how we actually trade on this, I’ll just say the same thing I’ve been saying since last week. Ride the wave up, don’t get killed. Don’t stand in the way of the trade but watch for spots for turning. This market is heading into some weird waters now and I have no idea where things will resolve. Eventually the bill will come due and either we grow our economy to outpace the debt growth in recent years or assets will have to depreciate. I am not sure if the former is possible, but I do know that eventually the latter will happen and it ain’t going to end with a 3-week 10% dip.
